

Performance tools in the Linux terminal are great for monitoring system health and optimizing resource usage. Compared to desktop equivalents, they provide lower-level, real-time insights into CPU, memory, and disk activity, enabling users to identify bottlenecks, enhance application efficiency, and ensure a smoother overall experience.
Why Monitor System Performance from the Terminal?
There are some really compelling reasons to monitor system performance from your Linux terminal, so here are six.
- Low Resource Usage: Terminal-based tools consume fewer resources. This helps ensure faster performance monitoring without also taxing the system.
- Access to Remote Systems: If you prefer to administer your Linux systems remotely over SSH, then you can use the terminal to monitor performance without a graphical interface.
- Automation and Scripting: You can seamlessly integrate performance monitoring tools into scripts, allowing for automated reporting and alerts, while streamlining your workflow.
- Customization and Flexibility: Using command line options, combined with commands like piping output to grep or awk to later process, filter, and analyze output.
- Long-Term Monitoring and Logging: With persistent monitoring and logging, you can track performance trends over time and identify possible issues before they critically affect your system.
- It Just Looks Cool! There’s something about the sleek and powerful terminal experience that lends a sense of mastery of your system. Coupled with a more striking terminal emulator, and you’ll look like a true Linux wizard!
Linux already comes with built-in tools like htop and top to keep an eye on overall system health.

If you want to go beyond these tools, however, such as more detailed metrics, customizable alerts and notifications, and visual and interactive enhancements. Check out these five terminal-based Linux performance tools if you want to take advantage of all these advantages over the built-in Linux tools.
Glances
Glances is a cross-platform, Python-based real-time system monitoring tool. It provides a nice overview of system performance including CPU, memory, disk, and network usage.

Glances is designed to adapt to your terminal size, and you can access it locally or remotely. It comes with a built-in web interface, so you can access it from any device with a web browser. Plus, extensive support for plugins, which makes it highly customizable and integrable into different workflows.

If you are looking for a performance monitoring tool that provides flexible real-time and remote monitoring, as well as advanced features like alerts and logging, Glances is a great choice for users looking to track system trends over time and address system performance issues.
nmon
nmon or Nigel’s Monitor is a lightweight, command-line-based performance monitor for Linux systems. It’s designed with efficiency in mind, consuming minimal resources while delivering detailed insights into system health.
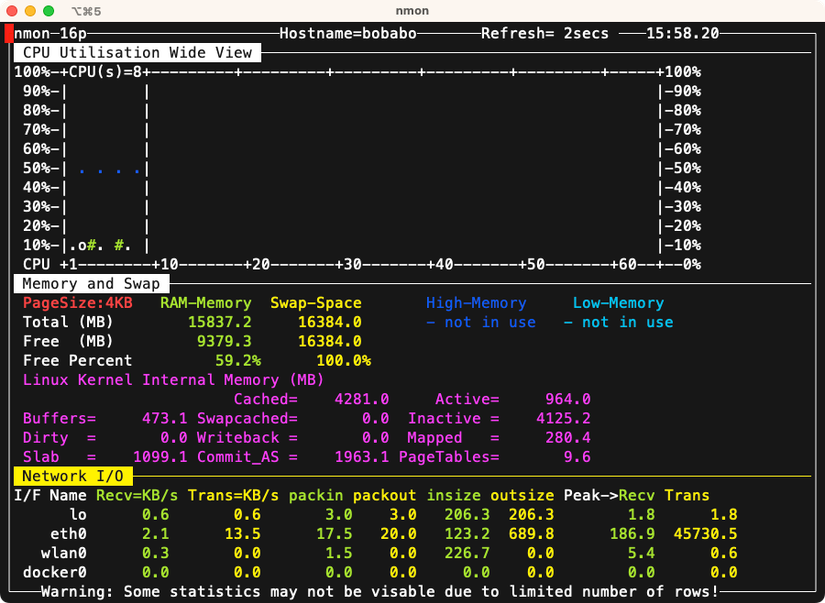
You can log all of nmon’s data to a file for later scrutiny, which makes it useful for long-term performance evaluation or for generating detailed system performance reports. Its focus on resource efficiency makes nmon an excellent choice for users who need a tool with low system impact, real-time monitoring, and robust historical data analysis capabilities.
bpytop
At the other end of the spectrum is bpytop. bpytop is a sleek, colorful, Python-based system monitoring tool that presents a real-time overview of resource usage, in an intuitive, visually striking interface. bpytop emphasizes both usability and aesthetics, offering users a modern and polished terminal experience.

That said, it is no less responsive and the user interface includes features such as easy process management and sorting. With its clear focus on usability and aesthetics, bpytop is ideal for users who prefer a detailed, attractive interface that balances functionality with ease of use, providing clear insights into system performance at a glance.
bashtop
bashtop is the predecessor to bpytop and is therefore similar, but is written in bash. It offers a similarly clean and interactive user interface, though it may run slightly slower due to its bash-based architecture.

It offers an efficient monitoring experience while maintaining a low footprint. Sysadmins who enjoy working in bash environments will appreciate bashtop’s lightweight structure and its ability to deliver detailed system insights without the need for additional dependencies.
atop
atop may look simple, but it’s a powerful, full-featured system and process monitor for Linux systems, designed for both real-time and long-term monitoring.

atop’s biggest appeal is that it collects detailed performance data over extended periods of time, which allows users to analyze historical trends and find bottlenecks. This means it will capture comprehensive metrics such as CPU, memory, disk I/O, and network activity and retain logs on them for later review. For users looking for robust system analysis and troubleshooting, particularly on production systems, atop’s ability to track historical trends and retain performance logs makes it an indispensable tool for long-term monitoring and diagnostics.
Installing and Using
No matter the system, you can easily install each of these tools on the command line using your system’s package manager. For example, to install Glances:
sudo apt install glances # for Debian/Ubuntu
sudo dnf install glances # for Fedora
sudo pacman -S glances # for Arch Linux
Then, you just type the name of the package on the command line to start it and the keyboard to use it. Typically, for tools such as these, the experience will be similar to that found on top and htop. You can use the arrow keys and Tab to move between different sections and fields, sort processes like CPU with the C key and memory with the M key, and quit with Q.
If you find a tool you really like and truly want to master, you can always check out its man page to learn all of its ins and outs.
Using terminal-based performance monitoring tools is a powerful way to optimize your Linux system’s efficiency. Options such as Glances, nmon, bptyop, bashtop, and atop allow you to gain real-time insights and detailed analysis without drastically impacting system resources. Each of these tools offers unique features and appearances tailored to different needs. This means that whether you’re managing local or remote systems, you’ll have the right solution at your fingertips!


