

Executive summary:
- Long yields had the biggest monthly decline since December 2008
- Equities end three-month losing streak, posting best month in over a year
- Disinflation and a softening labor market reinforced an end to the rate hike cycle
- VIX falls to the lowest level since pre-pandemic
- Holiday sales increased from 2022
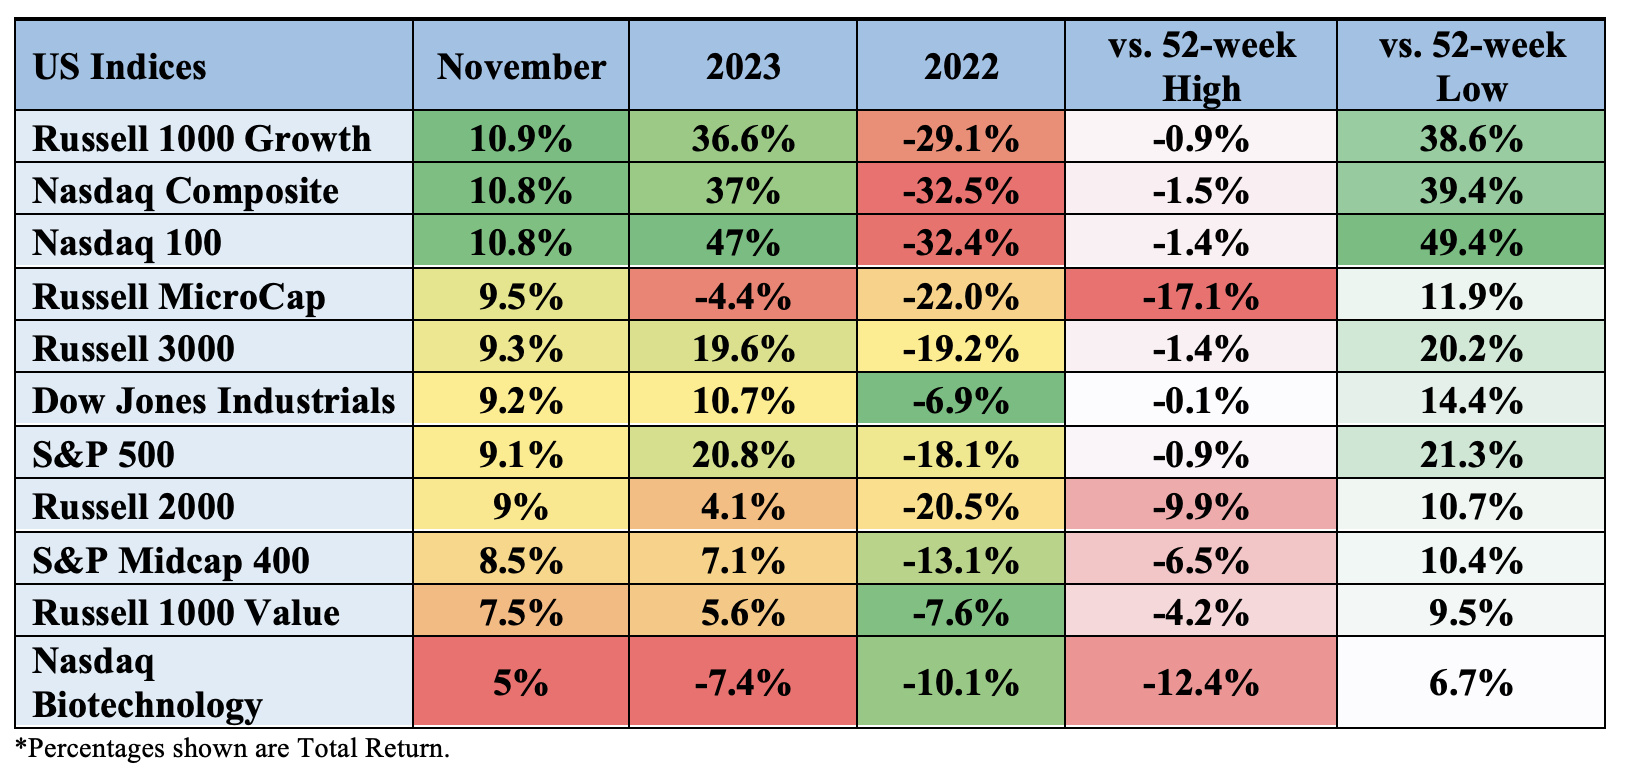
Index performance
Sector performance

Stocks broke a three-month losing streak while posting their best month in well over a year. All three major U.S. stock indexes ended November at least 8% higher, with the Dow Jones Industrial Average reaching a new 2023 high. On a total return basis, the Nasdaq gained 10.8%, the Dow rose 9.2% and the S&P 500 ended the month up 9.1%. The Nasdaq 100 is on pace to register its 3rd best annual performance in 20 years.
November traditionally kicks off the best six months of the year for equities due in part to stock buybacks and pension plans picking up at the beginning of the month, while mutual fund tax-loss selling ends in October.
Nasdaq-100 Index – NDX (daily period)

Small caps reversed October declines:
In early November, small-cap companies saw their best day since November 2022 following the Treasury’s lower future issuance forecast, oversold conditions, and softer economic data. The Russell 2000 Index – the world’s most closely followed gauge of smaller companies – declined for the third consecutive month in October but reversed course in November with a 9% gain for the month.
On a sector basis, all industries within the Russell 2000 were down in October, and all but Energy saw gains in November. Most notably, small-cap Health Care stocks within the Russell 2000 were down more than 11% on average in October but closed up over 10% this month. Tech stocks within the index were lower by more than 10% during the previous month but have since rallied over 12%.
Russell 2000 – RTY (weekly period)

Russell 2000 Sector Breakdown

November’s equity gains were accompanied by a bond rally that saw the yield on the 10-year U.S. Treasury slide to 4.35% from a peak of 5% in October, representing its biggest net monthly decline since December 2008. The U.S. aggregate bond index rose nearly 5% in November for its biggest monthly gain in over 35 years.
U.S. Aggregate Bond Index one year

The disinflation narrative, coupled with a softening labor market and peak Fed hawkishness, were the main drivers of the broad-based rally. As inflation falls and the labor market softens, the “soft-landing” or “no-landing” scenario seems to be in play (see below “Economic Commentary”). Fed fund futures are now pricing in a 60% chance of a 25bps cut in March. 2024.
The November FOMC meeting kept rates unchanged (as expected). Chair Powell offered the status quo messaging, saying, “committee is moving carefully and is assessing oncoming data to assess the extent to which policy is restrictive enough,” noting that we are still a long way away from the 2% target for inflation.
Rate Cut Odds for March 2024 …

… suggest deeper cuts for all of 2024

Treasuries:
The U.S. bond market soared this month as yields plunged (bond price and bond yield are inversely related), spurring an advance in speculative assets, including stocks, emerging markets, and crypto. The yield on the benchmark U.S.10-year Treasury now sits at 4.32%, down from a high of 4.92% earlier in the month. The 30-year yield declined over 11% and now sits at 4.49%. Shorter term 2s declined nearly 8% for the month, now yielding 4.68%. The yield curve remains inverted.
10-Year Treasury Constant Maturity Minus 2-Year Treasury Constant Maturity

2-year Treasury yield, one month

Holiday Sales:
A record 200.4 million Americans went shopping in stores or online over the Black Friday weekend (Thanksgiving – Cyber Monday), according to the National Retail Federation (NRF). This is nearly a 1.9% increase from last year’s 196.7 million shoppers. Sales were good but not robust, with an average spend of $321 on holiday-related purchases. According to Mastercard Spending Pulse, retail spending on Black Friday increased by only 2.5% from last year. Separately, Adobe Analytics reported online sales on Cyber Monday totaled $12.4 billion, a 9.6% increase from last year. Cyber Week (Thanksgiving to Cyber Monday) brought $38 billion overall, up 7.8% YoY. NRF estimates U.S. retail sales for November and December will increase 3-4% for the year compared to 2022, to the tune of ~$965 billion.
The S&P Retail Index gained 8.8% in November

Earnings commentary:
Earnings season has nearly concluded, and corporate profits for the S&P 500 grew modestly above expectations in Q3’23. According to Bloomberg data, the average upside beat was 7.68% for the quarter, while sales increased by 0.95%. The earnings growth rate increased 4.5%, while sales growth rose 1.85%. Sectors that saw outsized earnings growth included Communications (+44%), Consumer Discretionary (+35%), and Financials (+17%), while Energy (-36%), Materials (-20%) and Health Care (-20%) declined. Interestingly, FactSet pointed out that 281 of the S&P 500 constituents mentioned the term “inflation” on their Q3 calls.
Economic commentary:
October was the 21st consecutive month with an unemployment rate below 4 percent. However, the report showed slower payroll growth, rising unemployment and slower average hourly earnings growth, which is exactly what the FED wants to see. The U.S. Department of Labor’s Nov. 3 Employment Situation Report for October posted a weaker-than-expected number on job creation (+150,000 new vs +180,000 consensus). The unemployment rate ticked higher to 3.9% (+3.8% consensus) and average hourly wage growth on a month-over-month basis slowed to +0.2% (+0.3% in September). The labor force participation rate declined from 62.8% in September to 62.7%.
October headline CPI was unchanged from September (September increased 0.4% M/M) and below consensus of +0.1%. Core-CPI, which excludes food and energy, increased 0.2% M/M (consensus +0.3%). On an annualized basis, total CPI rose 3.2% (below consensus +3.3%) versus 3.7% in September. Annualized core CPI was up 4.0% compared to 4.1% in September. Shelter continued to rise in October (+0.3% M/M and +6.7 Y/Y) but was offset by a large decrease in gasoline (-5% M/M) as the energy index fell 2.5% M/M and is now down 4.5% Y/Y. As far as the markets were concerned, there was nothing in this report to disrupt the disinflation narrative.
Continuing with the disinflation narrative, PPI decreased last month. October PPI declined 0.5% (consensus +0.1%), and the prior month was revised to +0.4% from +0.5%. October Core PPI was flat M/M (consensus +0.3%). September was also revised lower to +0.4% from +0.5%. Total PPI Y/Y was up only 1.3%, below estimates of +1.9% and below September’s print of 2.2%. Total PPI, ex-food and energy, was +2.4% Y/Y versus consensus of +2.7%. October’s monthly decline was the largest decrease in final demand prices since April 2020.
Retail sales (which do not adjust for inflation) noticeably declined in October following a strong September. Total retail sales decreased 0.1% M/M (consensus -0.3%) following an upwardly revised September (+0.9% from +0.7%). Ex-autos, retail sales increased 0.1% (consensus -0.2%) following an upwardly revised September (+0.8% from 0.6%).
U.S. Initial Jobless Claims (a leading indicator) remain at levels consistent with a tight labor market. For the week ending November 18th, new claims were 218,000 (in-line with consensus), below the four-week average of 220,000 claims. Continuing jobless claims rose to a two-year high at 1.927 million from 1.841 million.
The U.S. Department of Commerce’s second estimate for Q3’23 GDP showed strong growth at +5.2% (consensus was +5.0%), better than the advance estimate of +4.9%. The GDP Chain Deflator (price index) was revised up to 3.6% from 3.5%. Despite higher interest rates, the U.S. economy grew at an even stronger pace than expected, aided by a tight labor market and disinflation.
Personal income increased 0.2% in October (in-line with consensus) following a downwardly revised September (+0.3%), while personal spending increased 0.2% (also in-line) below September’s +0.7% level. The personal savings rate, as a percentage of disposable personal income (DPI), increased to 3.8% from 3.7% in September.
The Federal Reserve’s preferred measure of inflation declined in October, the latest sign that price increases are slowing down but are still above the 2% FED target rate. The PCE Price Index rose 3% Y/Y, vs +3.1% in September. Core PCE, which excludes food and energy, rose 3.5% vs +3.7 in September. On a monthly basis, the PCE deflator was flat (consensus +0.1%), while core increased 0.2% (in-line with consensus).
The Conference Board’s Consumer Confidence Index increased in November following three straight months of declines, rising to 102 (consensus was 101) following a downwardly revised 99.1 in October. The Expectations Index (based on consumers’ short-term outlook for income, business and labor market conditions) rose to 77.8 in November from 72.7 last month. A reading of 80 or below is historically associated with a recession within the next year.
CPI Inflation – YoY:

Oil:
Oil futures declined over 6% in November. YTD oil futures are down 5%, and since the September peak of $93.68, they have declined 18%. On a related note, OPEC+ agreed to a voluntary production cut of 900,000 barrels per day in addition to extending 1.3 million bpd in production cuts already in place, led by Saudi Arabia and Russia, respectively. Many analysts have voiced skepticism that this will be fully implemented.
According to AAA data, the average cost of a gallon of regular gas in the U.S. is $3.246, down $0.25 or 7% from last month. One year ago, the average price of regular unleaded was $3.495.
Crude Oil front month contract for November:

Dollar:
The dollar declined 3% in November. Since inflation peaked in 2022, the dollar has declined over 9%. A weaker dollar is generally good news for both equity markets and commodities, just as a strong dollar tends to hold back stocks and other risky investments. So, as the disinflation narrative plays out, pricing pressures ease, and the expectation the Fed will start to cut interest rates soon, speculators are wagering that the dollar could lose more steam as U.S. equity markets rise.
DXY Index

Looking ahead:
Seasonal trends are favorable as December is the third-best month of the year for stocks going back to 1970. Equities are already off to a strong start in the first session of December, driven in large part by Federal Reserve Chair Jerome Powell’s public remarks where he noted the Fed’s policy rate is “well into restrictive territory.” This is a noticeable shift from late October when he described Fed rate policy as not “too tight” right now. Accordingly, there is increasing conviction the 18-month rate hike cycle is in the rearview mirror.
On the economic calendar, the November Jobs report is released Friday morning (12/8). Economists are expecting the unemployment rate to remain at 3.9%. CPI will be released on Dec. 12, followed by PPI on the 13th. The next FOMC rate decision will be on Dec. 13. On Dec. 15, we have “triple witch” options expiration and the concurrent S&P Index rebalancing.

The information contained herein is provided for informational and educational purposes only, and nothing contained herein should be construed as investment advice, either on behalf of a particular security or an overall investment strategy. All information contained herein is obtained by Nasdaq from sources believed by Nasdaq to be accurate and reliable. However, all information is provided “as is” without warranty of any kind. ADVICE FROM A SECURITIES PROFESSIONAL IS STRONGLY ADVISED.


