

- Bitcoin price could rise 20% to tag the $50,000 psychological level next if it overcomes the immediate roadblock at $43,860.
- Ethereum price could rise 5% to flip the $2,300 resistance into a support floor as ETH bulls show resilience.
- Ripple price’s two-week consolidation could precipitate a 5% crash as markets tend to lack patience.
Bitcoin (BTC) price is trading within a weekly supply zone. If it manages to break and close above its midline, the mean threshold, this could open the skies for a continuation of the trend north, potentially bring $50,000 into focus.
Also Read: Top 5 tokens trending alongside Bitcoin: ORDI, STX, LUNC, PEPE, CFX
Bitcoin price eyes 20% surge to $50,000
Bitcoin (BTC) price is trading with a bullish bias. The move above the $42,000 psychological level has inspired Bloomberg to provide a rather ambitious target for the largest cryptocurrency by market capitalization.
According to the news site, Bitcoin price “topping $42,000 is just the start of a fresh crypto supercycle that will push the world’s biggest token above $500,000 in what adherents say is the new monetary order taking Wall Street by storm.”
Meanwhile, Bitcoin price is stuck within a weekly supply zone extending from $40,517 to $46,972. To confirm the continuation of the primary trend (bullish on the weekly timeframe), the price must break and close above the midline of the supply barrier at $43,860.
A decisive move above the aforementioned level could see Bitcoin price extend the gains, flipping the supply zone into a bullish breaker as BTC extends to the forecasted $50,000 psychological level.
In a highly bullish case, the gains could tag the $55,560 resistance level. It is even possible to extrapolate these gains to the $66,098 range high. Such a move would constitute a 56% climb above current levels.
The Relative Strength Index (RSI) supports this outlook as its ascension shows rising momentum. Similarly, histogram bars on the Awesome Oscillator (AO) are green in positive territory, which demonstrates that bulls are leading the market. These add credence to the bullish thesis.
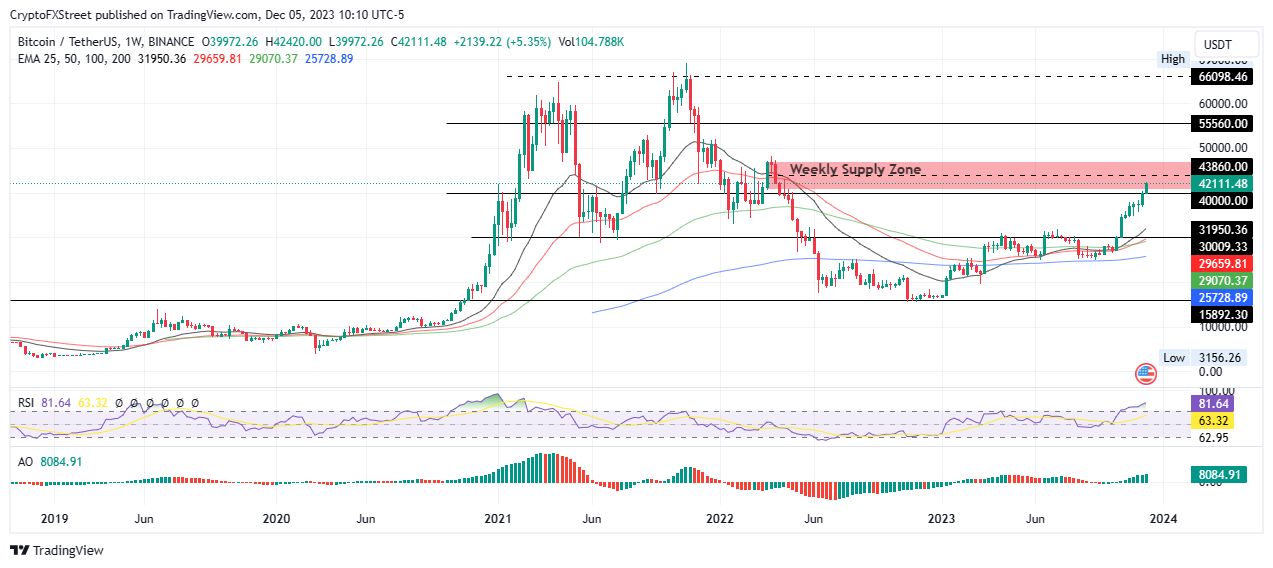
BTC/USDT 1-week chart
Conversely, a rejection from the supply barrier could see Bitcoin price pull south, first losing support at $42,111. The slump could send BTC as low as the $30,009 support level, 30% below current levels.
Also Read: Bitcoin price could scrape $40,000 before a bigger dip, key levels to watch
Ethereum price eyes a 5% surge
Ethereum (ETH) price remains confined within a bullish technical formation, which could deliver 5% gains if sustained. Such a move would see the largest altcoin by market capitalization flip the $2,300 resistance level into a support floor.
The position of the Relative Strength Index (RSI) at 69 not only points to strong price strength but also shows there is more room to the north before ETH becomes overbought. The AO histogram bars corroborate the stance, showing bulls are leading the market.
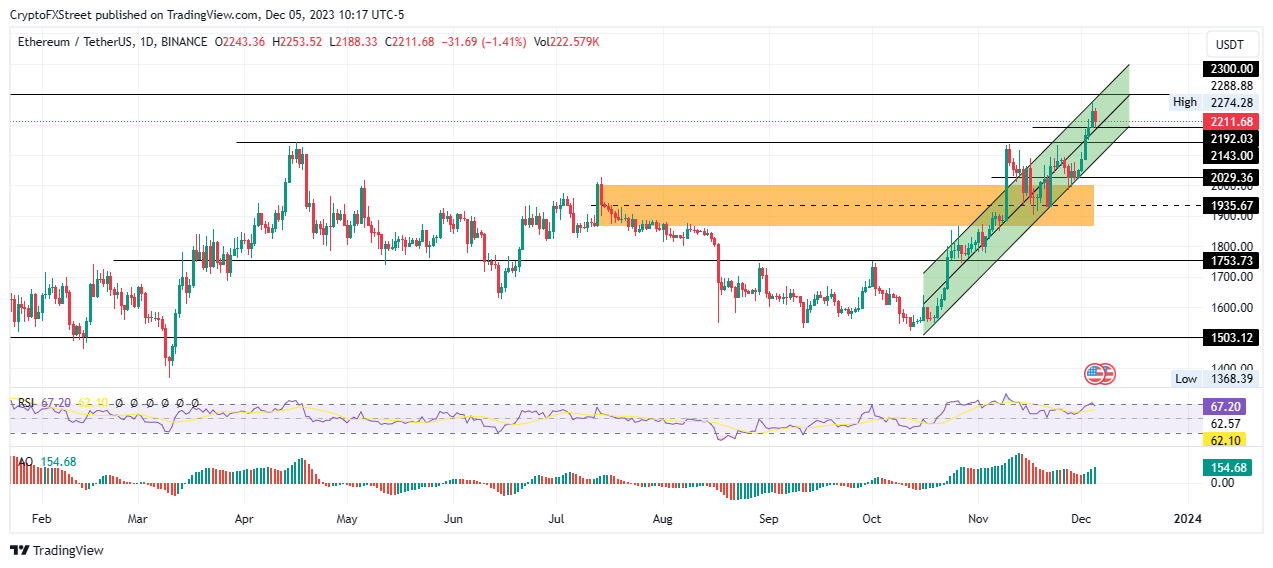
ETH/USDT 1-day chart
On the flipside, enhanced seller momentum could send Ethereum price south, first losing the immediate support at $2,192 before a leg down to fall out of the confines of the channel under $2,143. In a dire case, ETH could slip past $2,029 to break below the $1,935 midline, confirming the continuation of the downtrend and invalidating the bullish outlook.
Also Read: Ethereum Price Prediction: ETH attempts to flip $2,300 into support
Ethereum FAQs
Ethereum is a decentralized open-source blockchain with smart contracts functionality. Serving as the basal network for the Ether (ETH) cryptocurrency, it is the second largest crypto and largest altcoin by market capitalization. The Ethereum network is tailored for scalability, programmability, security, and decentralization, attributes that make it popular among developers.
Ethereum uses decentralized blockchain technology, where developers can build and deploy applications that are independent of the central authority. To make this easier, the network has a programming language in place, which helps users create self-executing smart contracts. A smart contract is basically a code that can be verified and allows inter-user transactions.
Staking is a process where investors grow their portfolios by locking their assets for a specified duration instead of selling them. It is used by most blockchains, especially the ones that employ Proof-of-Stake (PoS) mechanism, with users earning rewards as an incentive for committing their tokens. For most long-term cryptocurrency holders, staking is a strategy to make passive income from your assets, putting them to work in exchange for reward generation.
Ethereum transitioned from a Proof-of-Work (PoW) to a Proof-of-Stake (PoS) mechanism in an event christened “The Merge.” The transformation came as the network wanted to achieve more security, cut down on energy consumption by 99.95%, and execute new scaling solutions with a possible threshold of 100,000 transactions per second. With PoS, there are less entry barriers for miners considering the reduced energy demands.
Ripple price risks a 5% crash
Ripple (XRP) price is trading without any directional bias with momentum indicators spelling concern as the RSI is below 50. Equally, the AO is in negative territory, showing that bears have established dominance in the XRP market.
As markets tend not to wait for long, Ripple price could fall 5% to lose the critical support at $0.5773. The slump could then extend toward the $0.4595 support floor.
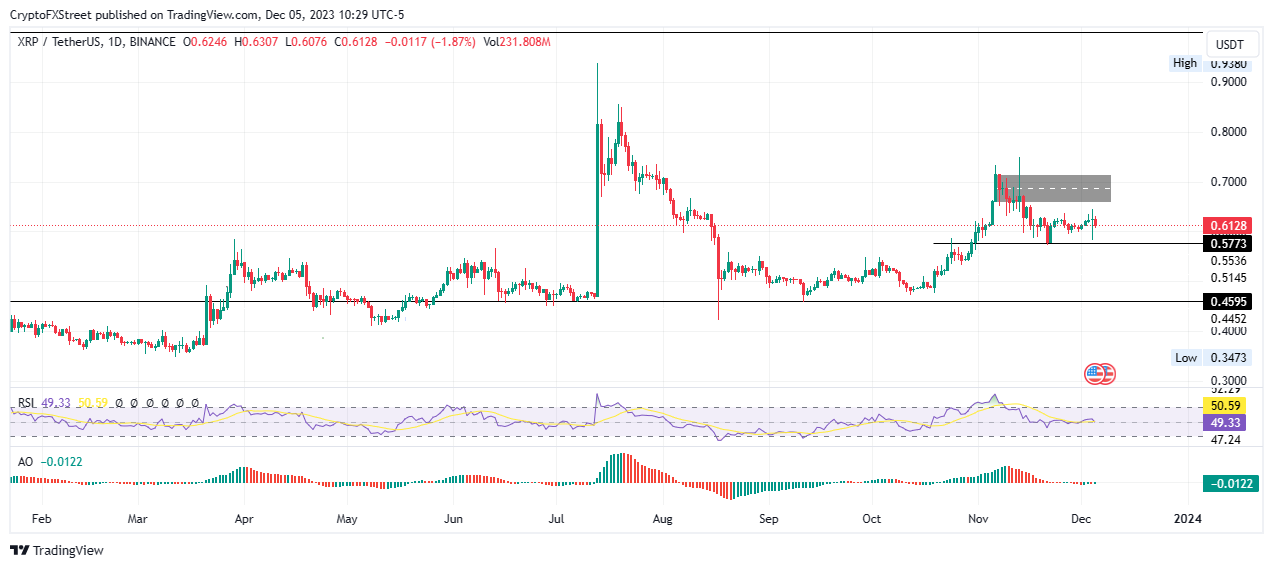
XRP/USDT 1-day chart
On the flipside, increased buying pressure could send Ripple price north, foraying into the supply zone extending from $0.6572 to $0.7161. A break and close above the midline of this order block at $0.6870 would confirm the continuation of the intermediate trend. A flip of this order block into support would set the tone for XRP price to target the $0.8000 psychological level next.


