

In just 10 days, POPCAT has dropped over 30%, but the decline may not be over. A deeper analysis of multiple indicators reveals that further declines could be on the horizon.
Inside POPCAT’s parallel channel
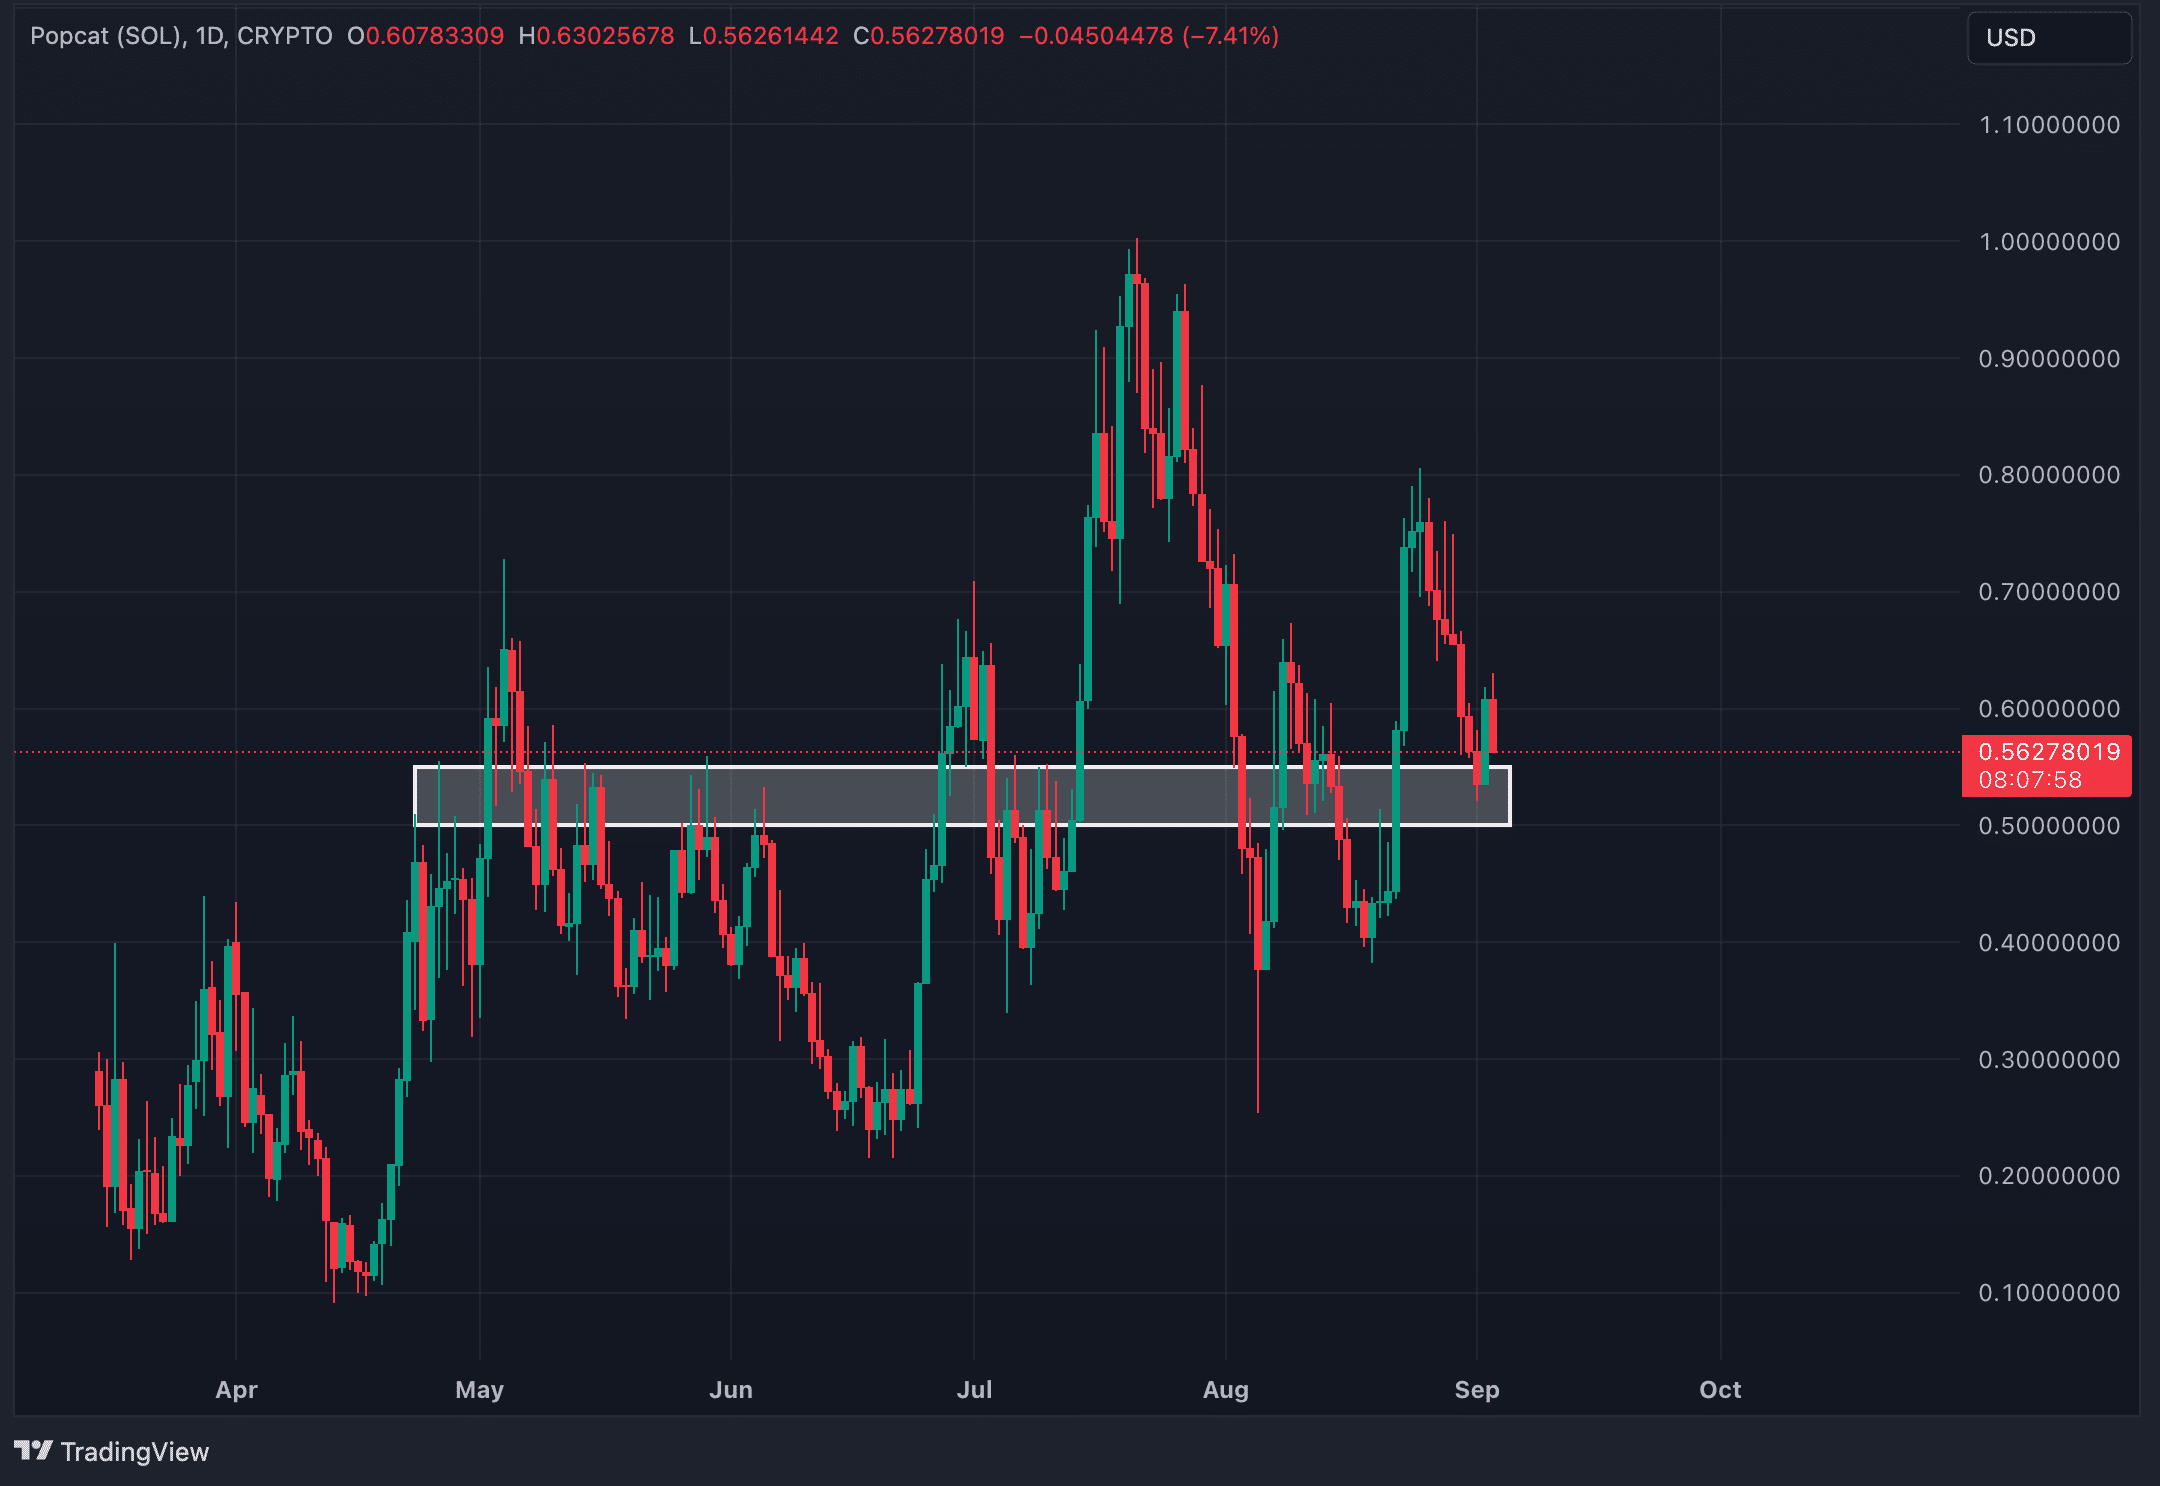
POPCAT respects a parallel channel that defines its movement. While there have been moments when the price broke above or below the channel, it continues to adhere to this pattern over time. The white lines on the chart offer a simplified representation of the price movements within the channel.
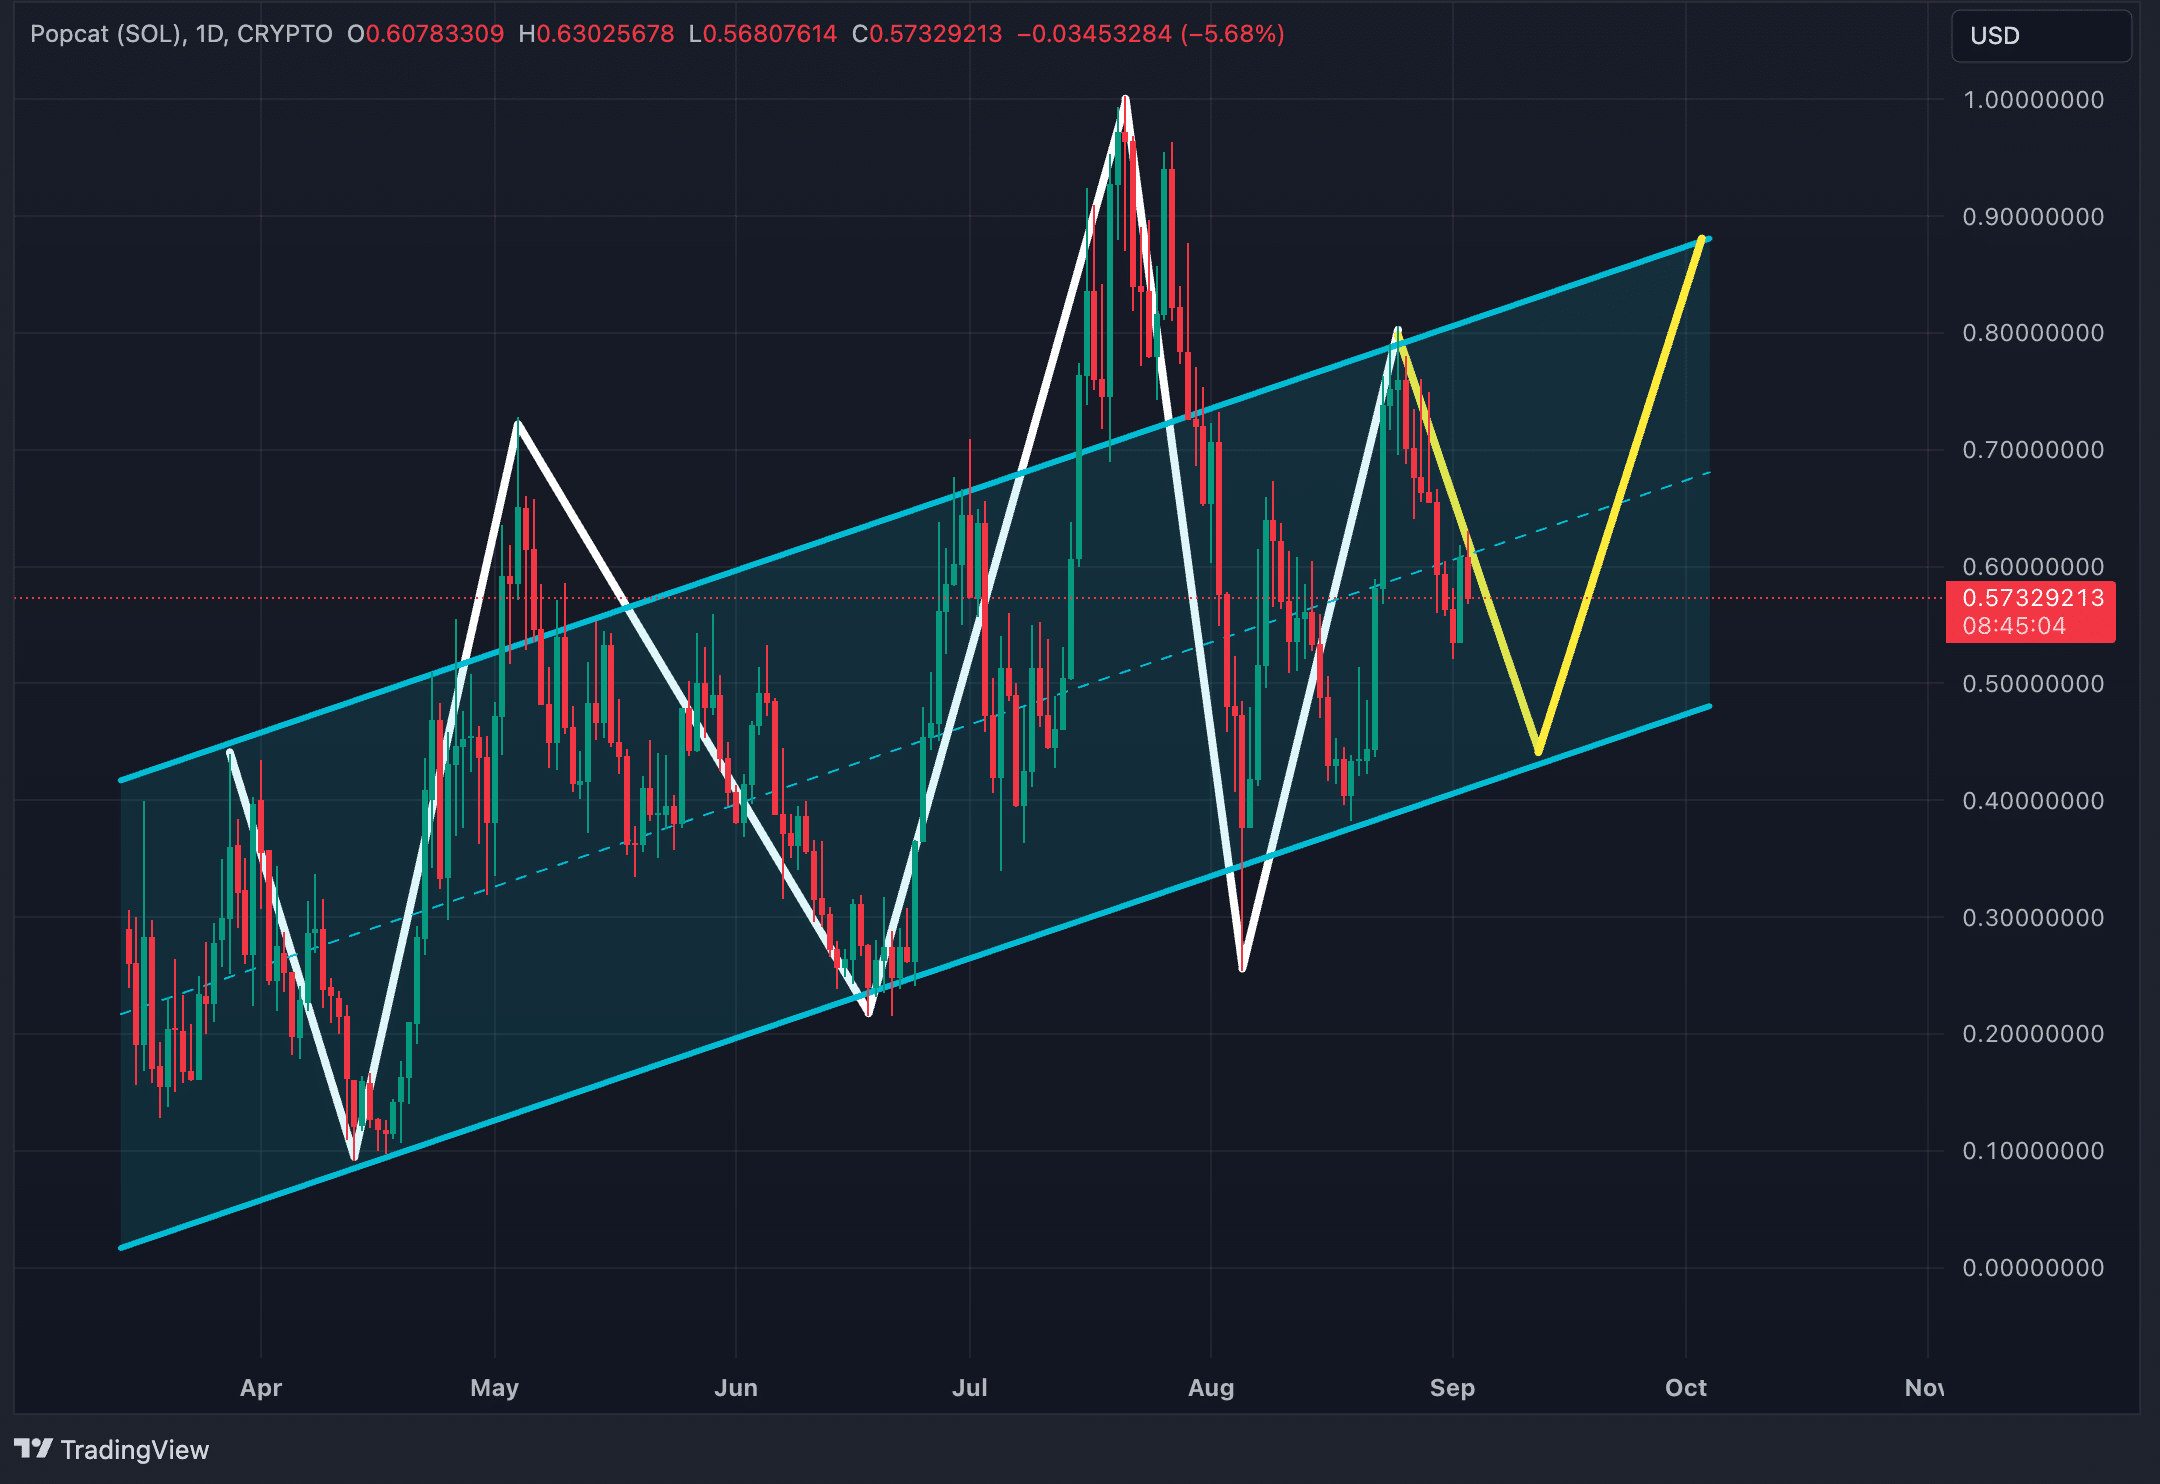
Looking ahead, the yellow lines depict a possible future path for POPCAT. The next move could see a drop to around $0.43 in the coming weeks, representing a further decline of over 23% from the current level. After this, the price may then rally towards $0.87 around October to November.
Gartley harmonic pattern on the verge of completion
One strong indication that supports the likelihood of a further downturn in POPCAT is the development of the Gartley harmonic pattern on its daily chart. The Gartley pattern is a type of harmonic price formation that signals potential reversal zones based on Fibonacci ratios and has an 85% success rate. It consists of five points—X, A, B, C, and D—and represents a retracement followed by a continuation of the overall trend.
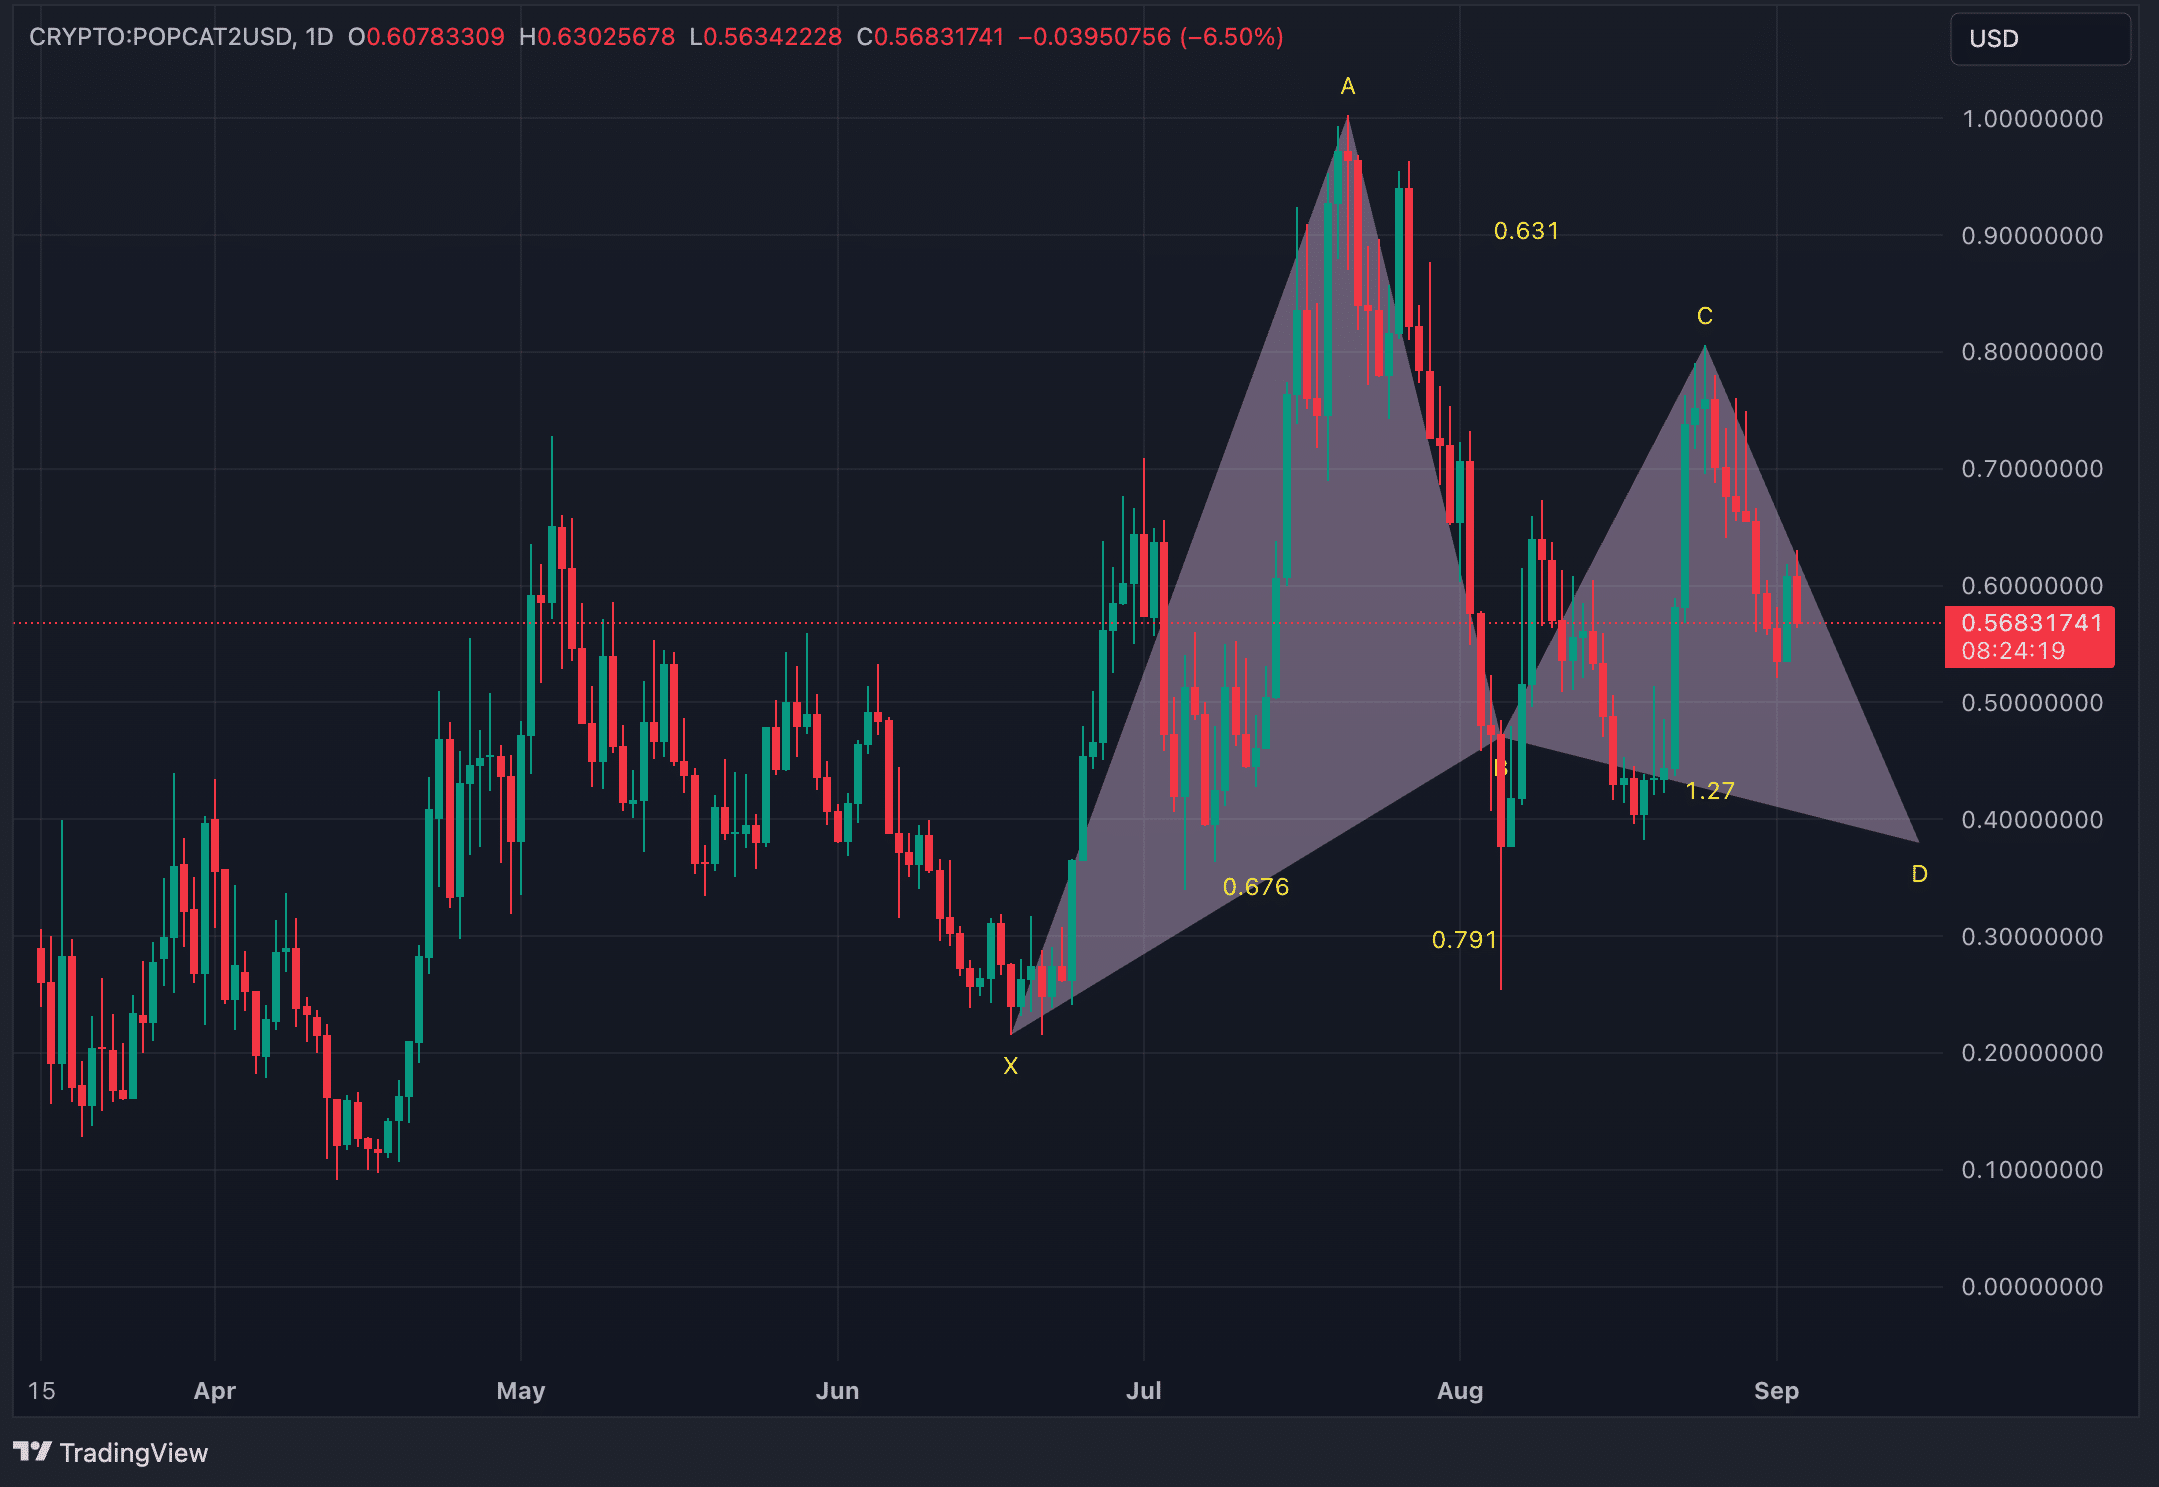
In the case of POPCAT, the pattern has formed with the final point D yet to be completed. If the Gartley pattern completes as expected, the price could drop to approximately $0.38. This target lies slightly below the lower boundary of the established parallel channel.
MACD Reversal
Another factor pointing toward a potential continued decline in POPCAT is the recent bearish crossover in the Moving Average Convergence Divergence (MACD) indicator. The MACD is a momentum indicator that consists of two lines: the MACD line and the signal line. It shows the strength and direction of a trend by analyzing the relationship between these two lines.
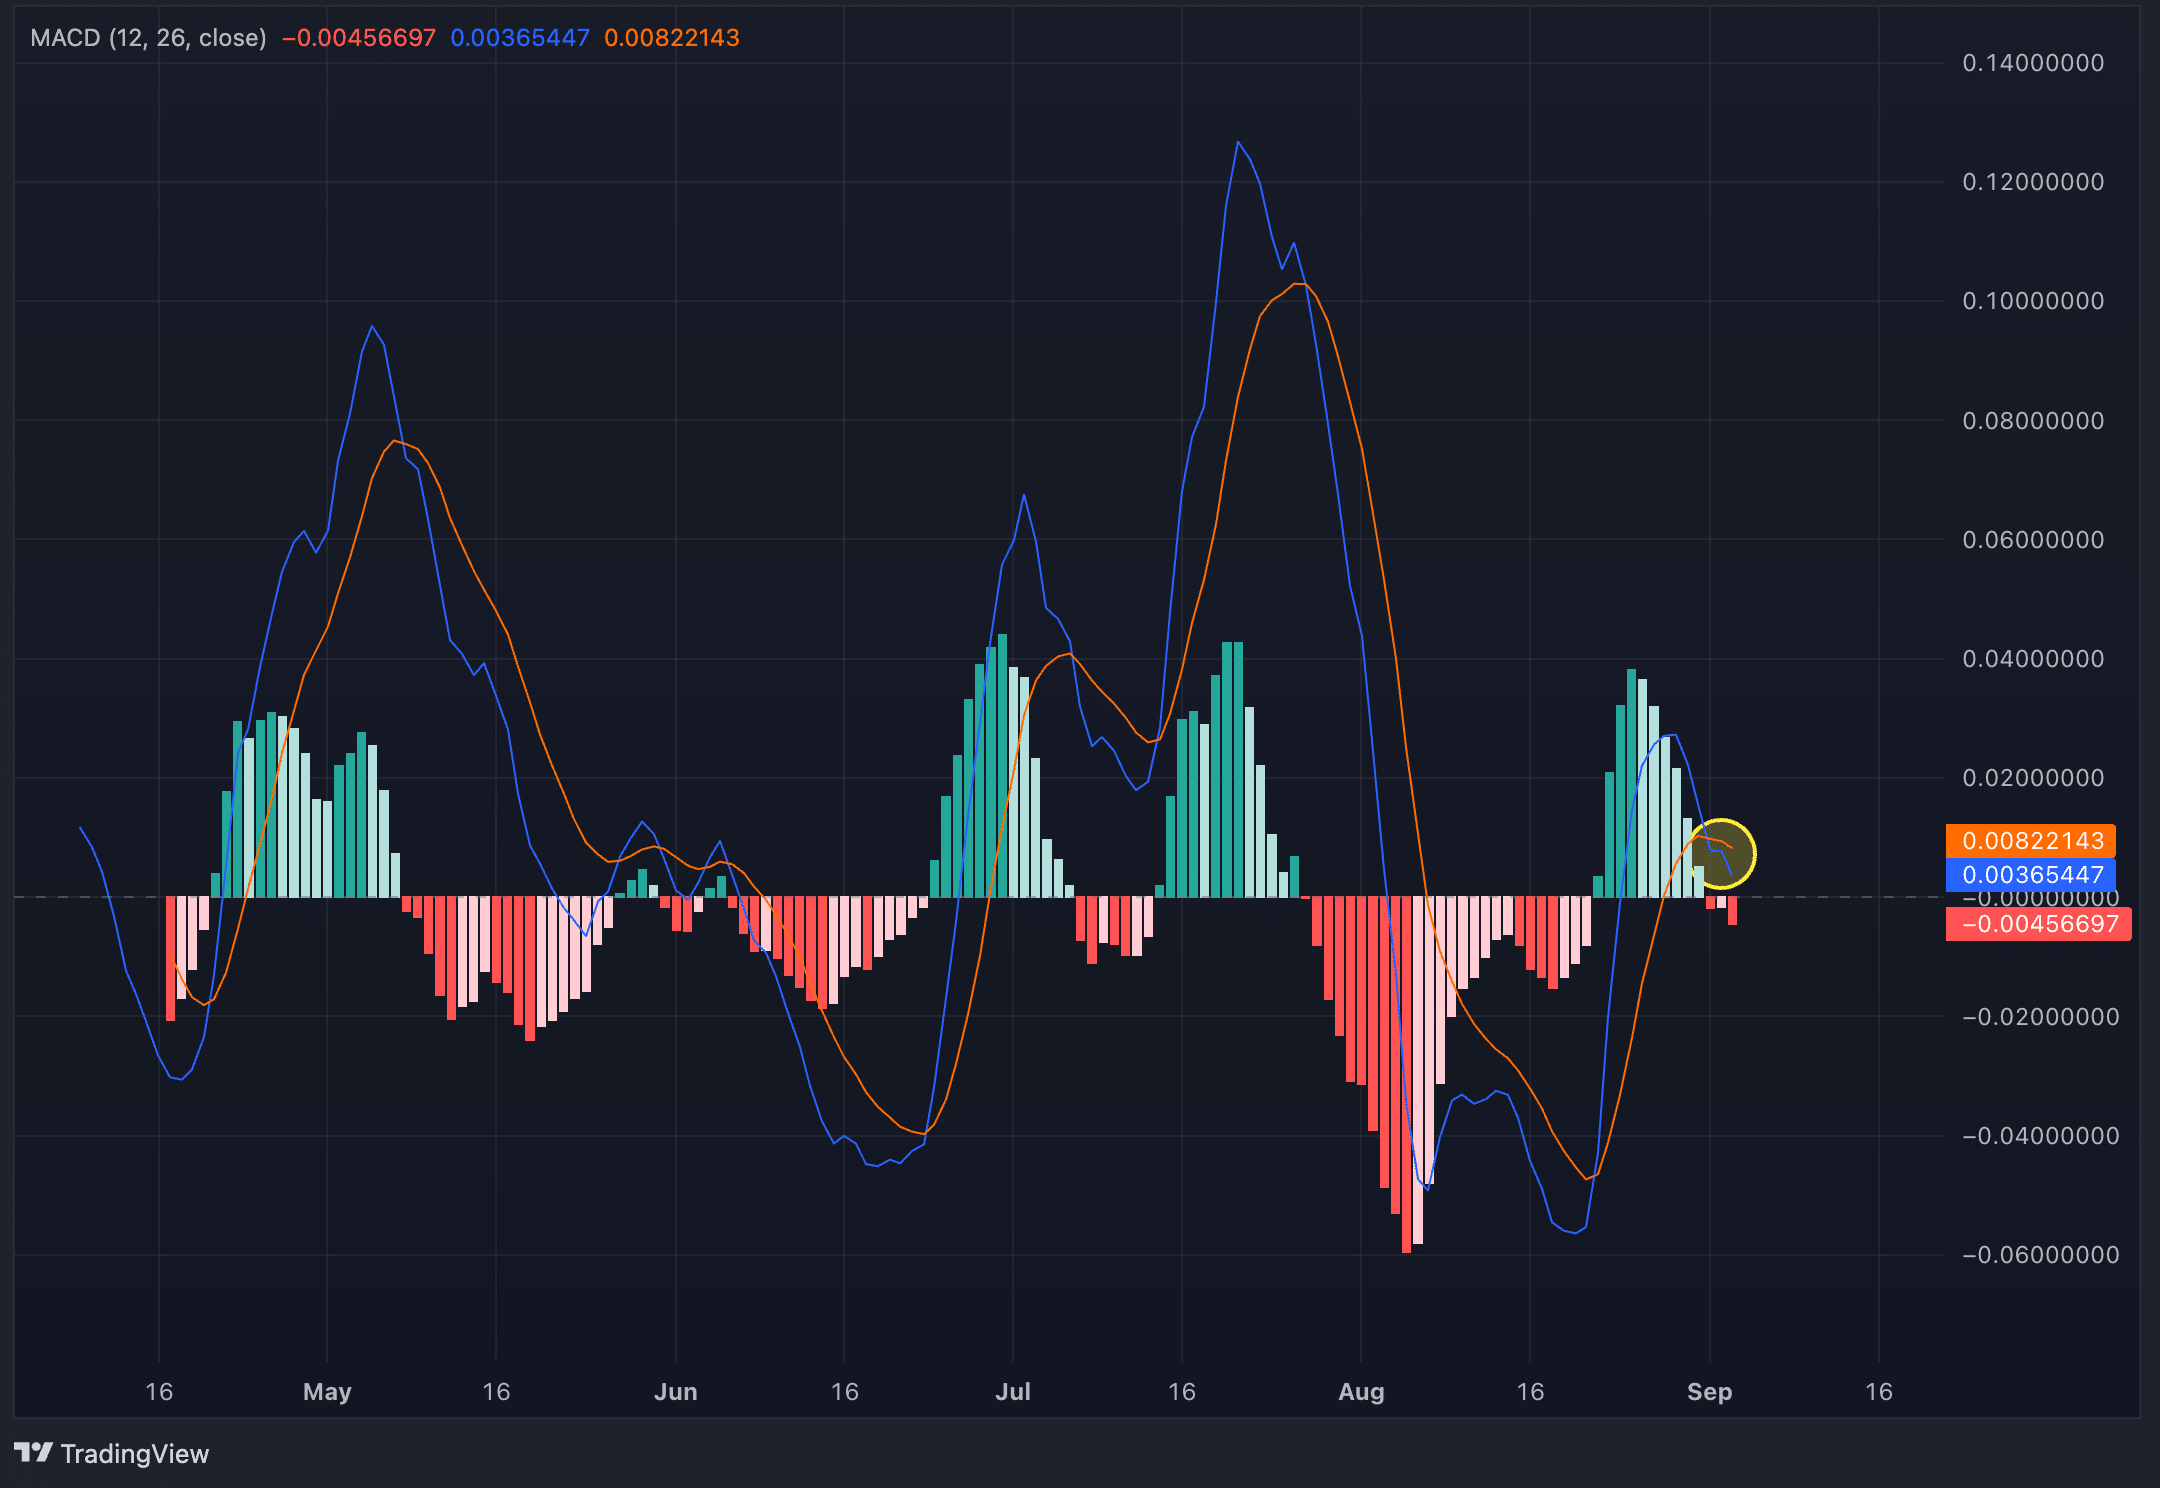
A crossover occurs when the MACD line crosses below the signal line, which is seen as a bearish signal, similar to a “death cross” in moving averages. The crossover means that the momentum has shifted from bullish to bearish.
Counterpoints: Limited downturn possibility
While several factors suggest a continued downturn for POPCAT, there are also indicators that could limit or even conclude the current decline.
First, there is a confluence of multiple Fibonacci golden pockets in the $0.53 to $0.593 range. These include the Fibonacci retracement from the low on August 19 to the high on August 25, the high on July 1 to the low on August 5, and the low on July 5 to the high on July 21. Additionally, the 50% retracement levels from other Fibonaccis also converge within this price zone, which strengthens the support in this area. Until POPCAT drops below $0.53, the downward movement will likely not continue. On the other hand, if it fails to break above $0.593, we also cannot confirm that the decline has ended.
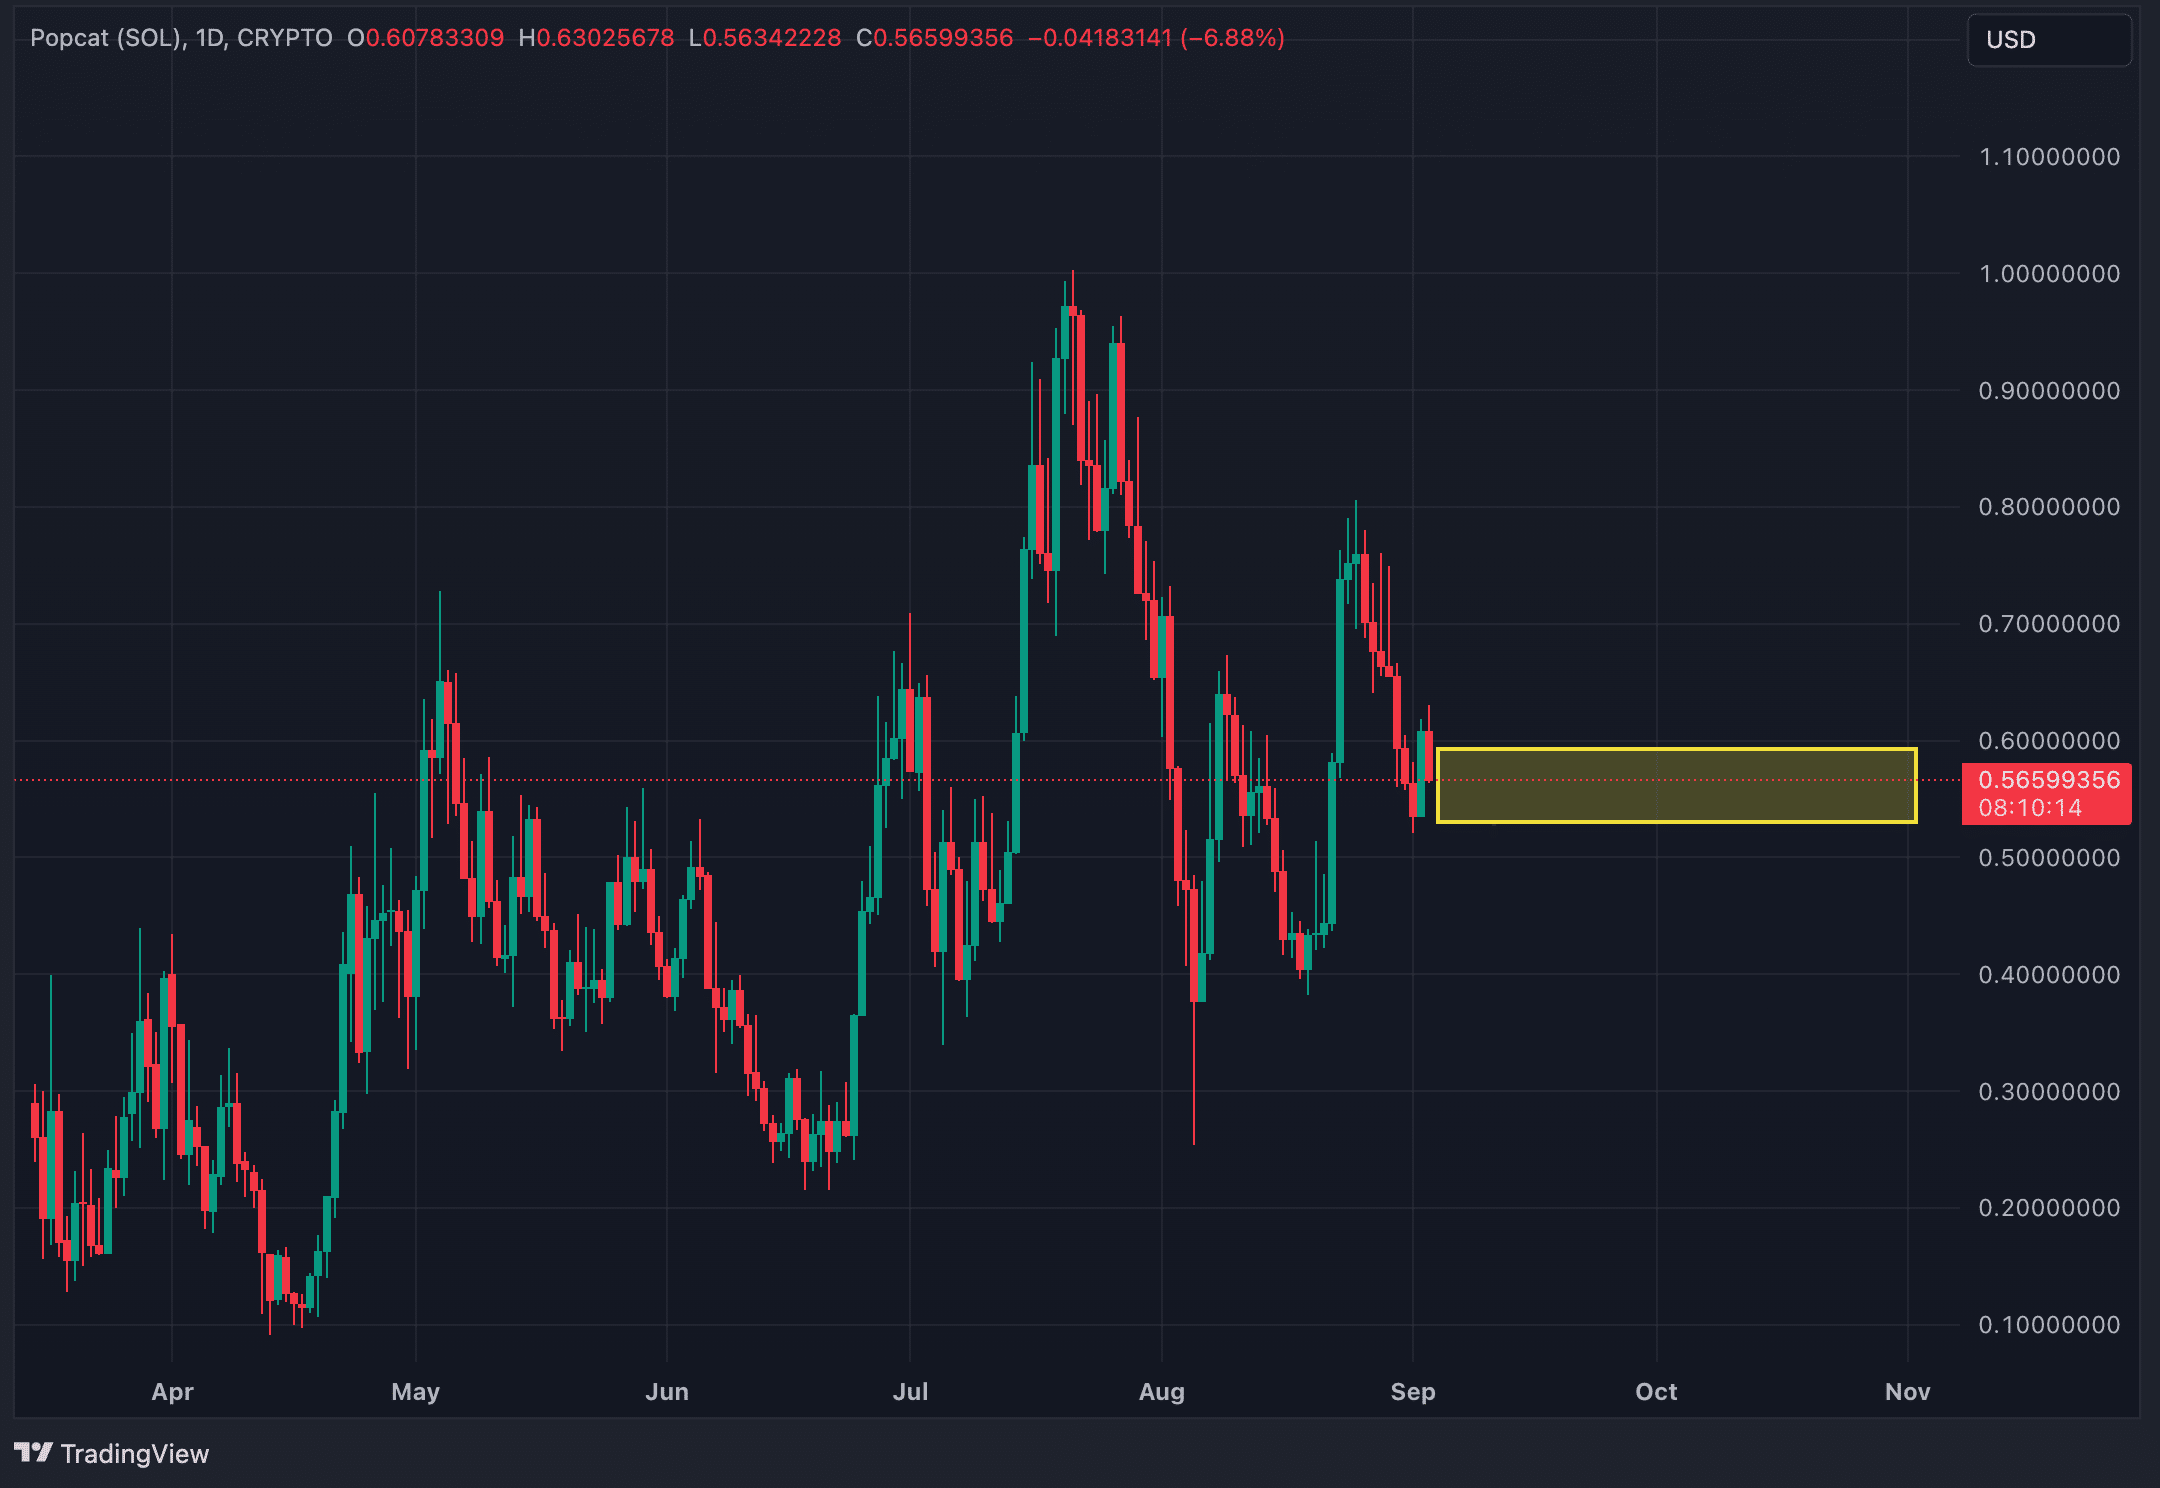
Adding to this, the historical volatility range for POPCAT between $0.50 and $0.55 has been quite an important zone, acting as support or resistance on 38 different occasions. The area closely aligns with the golden pocket confluence, which further reinforces the significance of this zone as a potential floor for the current downtrend.
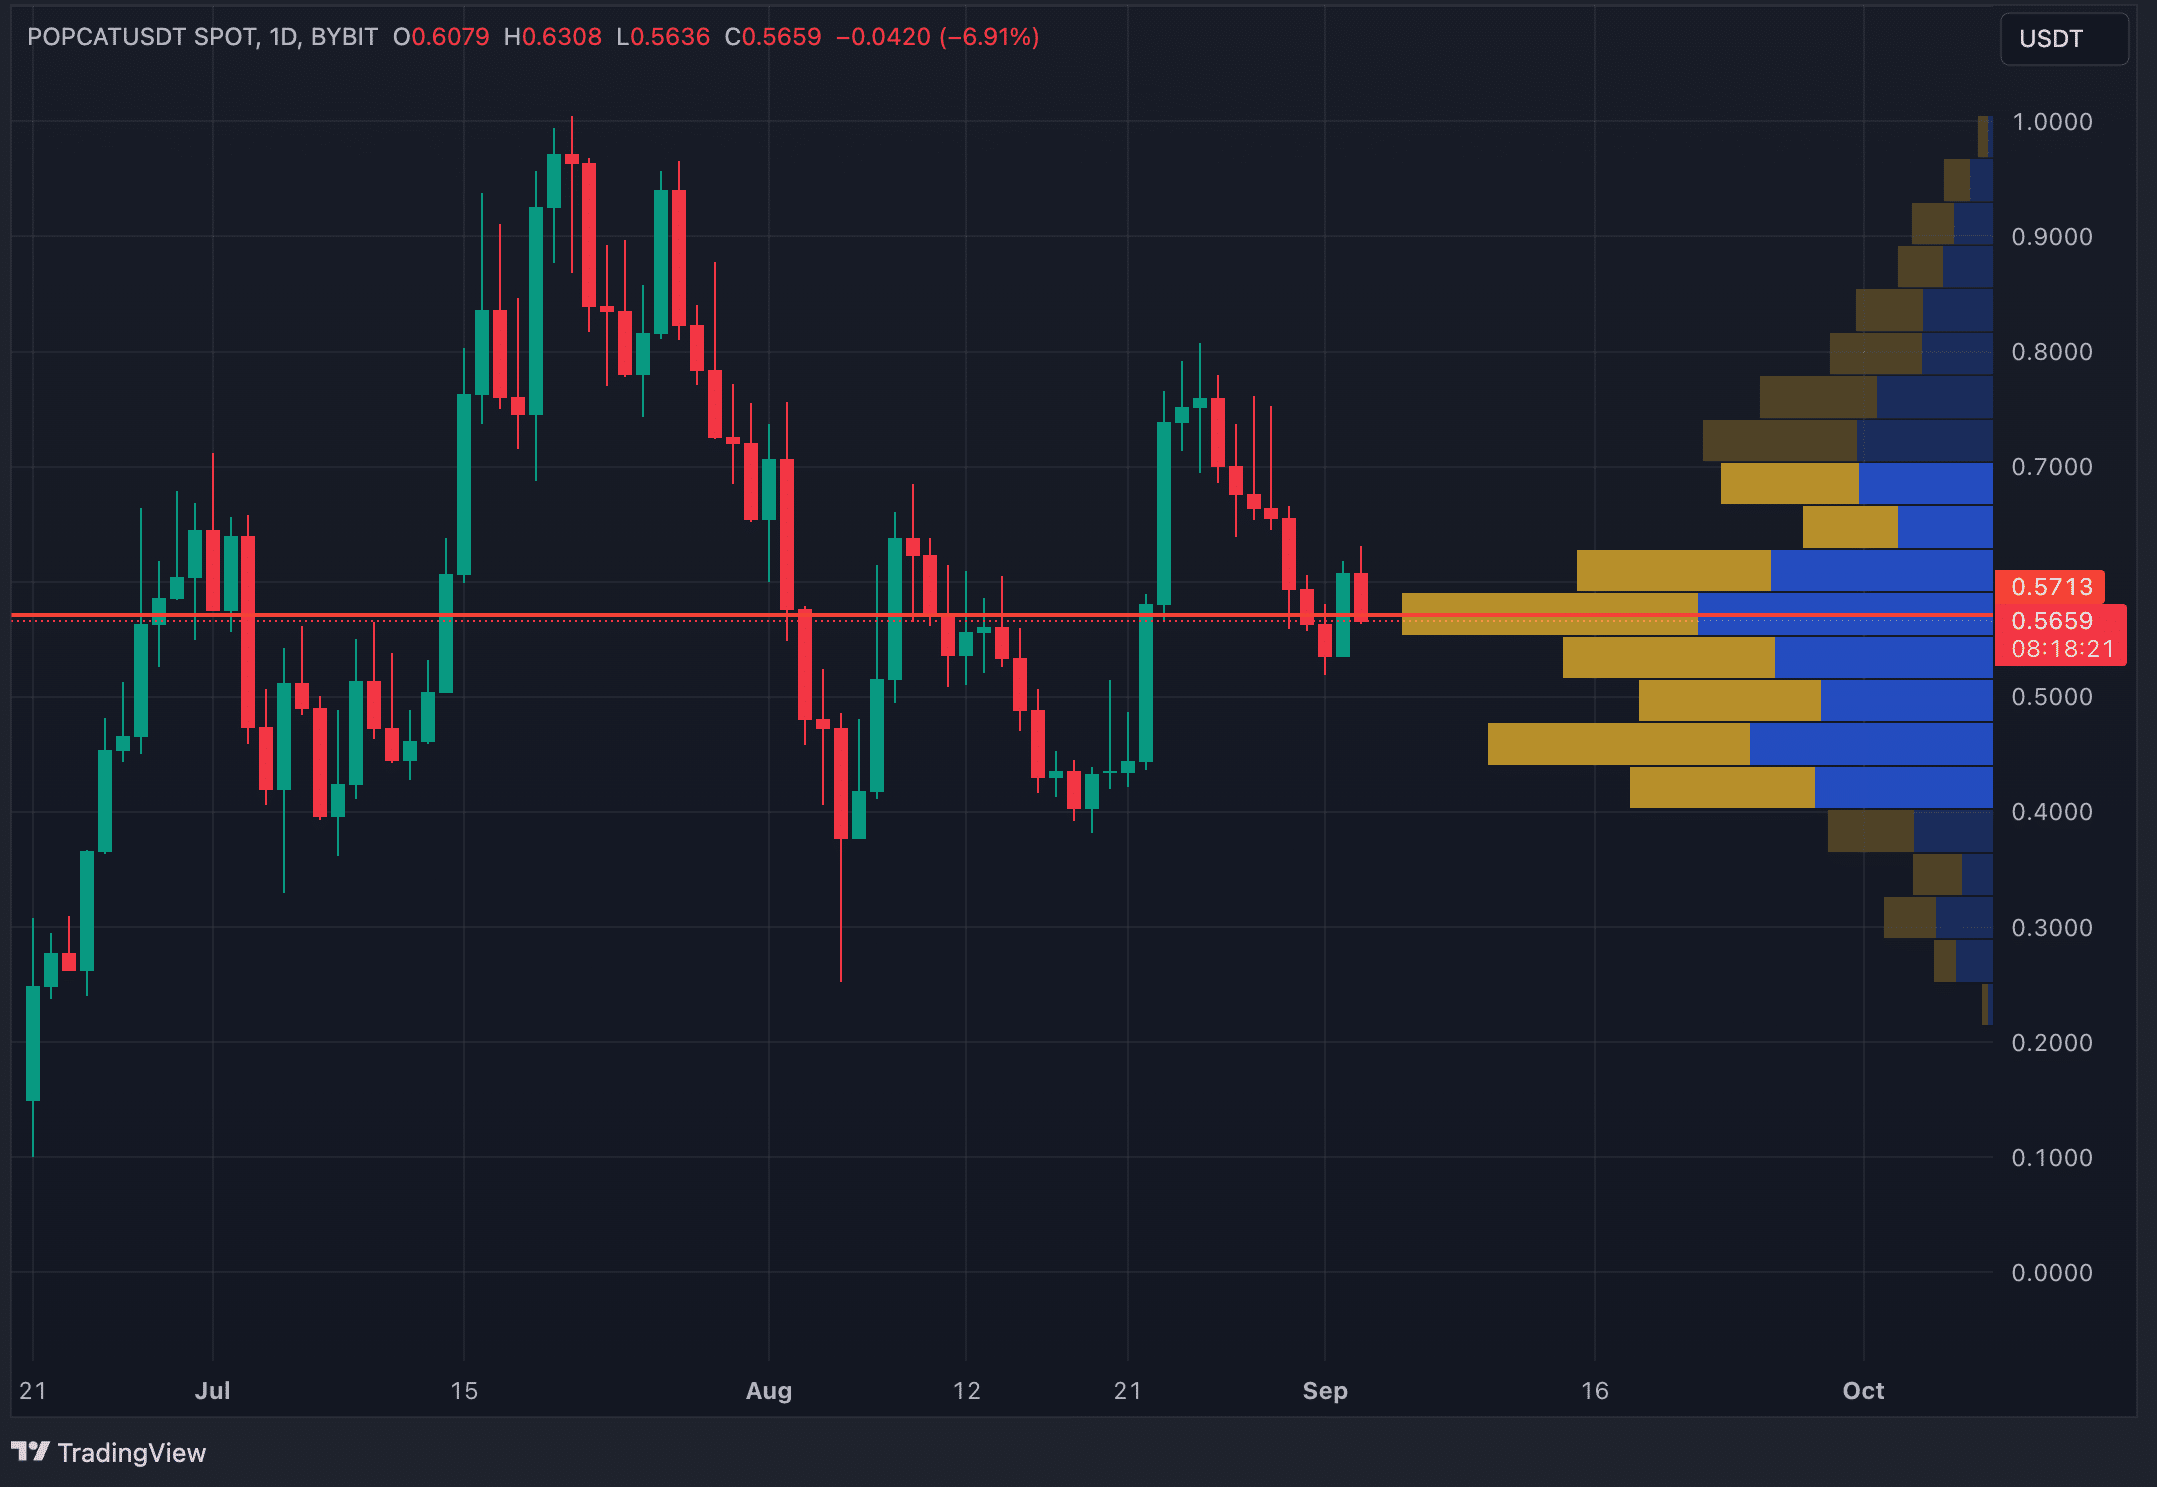
Lastly, the Visible Range Volume Profile (VRVP) adds another layer of support in the $0.55 to $0.593 area. The VRVP is a tool that displays trading activity at various price levels and highlights areas with high trading volumes as major zones of support or resistance. In this case, the volume bar in the $0.55 to $0.593 range is the biggest and suggests strong buyer interest. However, if POPCAT drops below $0.40, the volume profile thins out considerably, indicating little to no support below that level, which could lead to even steeper declines if breached.
Strategic considerations
At the current price level, POPCAT presents a conundrum. On the one hand, several indicators suggest further downturns, while on the other, key support levels hint that the bearish phase may have already run its course, with bullish momentum potentially on the horizon.
In our analysis, which aligns with insights shared in previous articles, the upcoming monetary policy shift—specifically the anticipated rate cuts in September—combined with the historically weak performance of cryptocurrencies in September could render these support zones for POPCAT obsolete. Given this outlook, the strategic approach would involve shorting POPCAT down to the $0.43 level.
Disclosure: This article does not represent investment advice. The content and materials featured on this page are for educational purposes only.

