

- BTC has over 138 million social activities, while LINK has over 50 million.
- Consecutive price trends have contributed to the increased social activity.
Recent data indicates that Bitcoin [BTC] and Chainlink [LINK] experienced an uptick in their social activity metrics. Examining their price trends provides insight into the underlying reasons for these recent surges.
Bitcoin and Chainlink lead social activity
Data from Lunar Crush, which ranks crypto assets based on social activity, revealed that Bitcoin and Chainlink claimed the top two spots, respectively.
The chart compared the rankings of six different assets. It showed that Bitcoin garnered over 138.7 million interactions, while Chainlink accumulated 56.6 million.
Notably, Chainlink’s social activity was particularly intriguing as it surpassed that of Ethereum and exceeded the combined total of the remaining three assets.
The social activity metric indicates the number of mentions these assets receive, which could be for various reasons. These mentions can draw more attention to the asset, whether positive or negative.
Bitcoin and Chainlink see enough chatters
According to AMBCrypto’s analysis of Bitcoin’s social volume on Santiment, it was observed that on 22nd April, the social volume was higher than the previous day. However, compared to the days preceding, the social volume had decreased.
Despite this decline, Bitcoin’s social volume remained higher than that of Chainlink, as anticipated.
At the time of this writing, the social volume for Bitcoin was over 1,100, whereas for Chainlink, it stood at 18. Specifically, on 22nd April, Bitcoin’s social volume reached over 5,200, while Chainlink’s was 199.
Source: Santiment
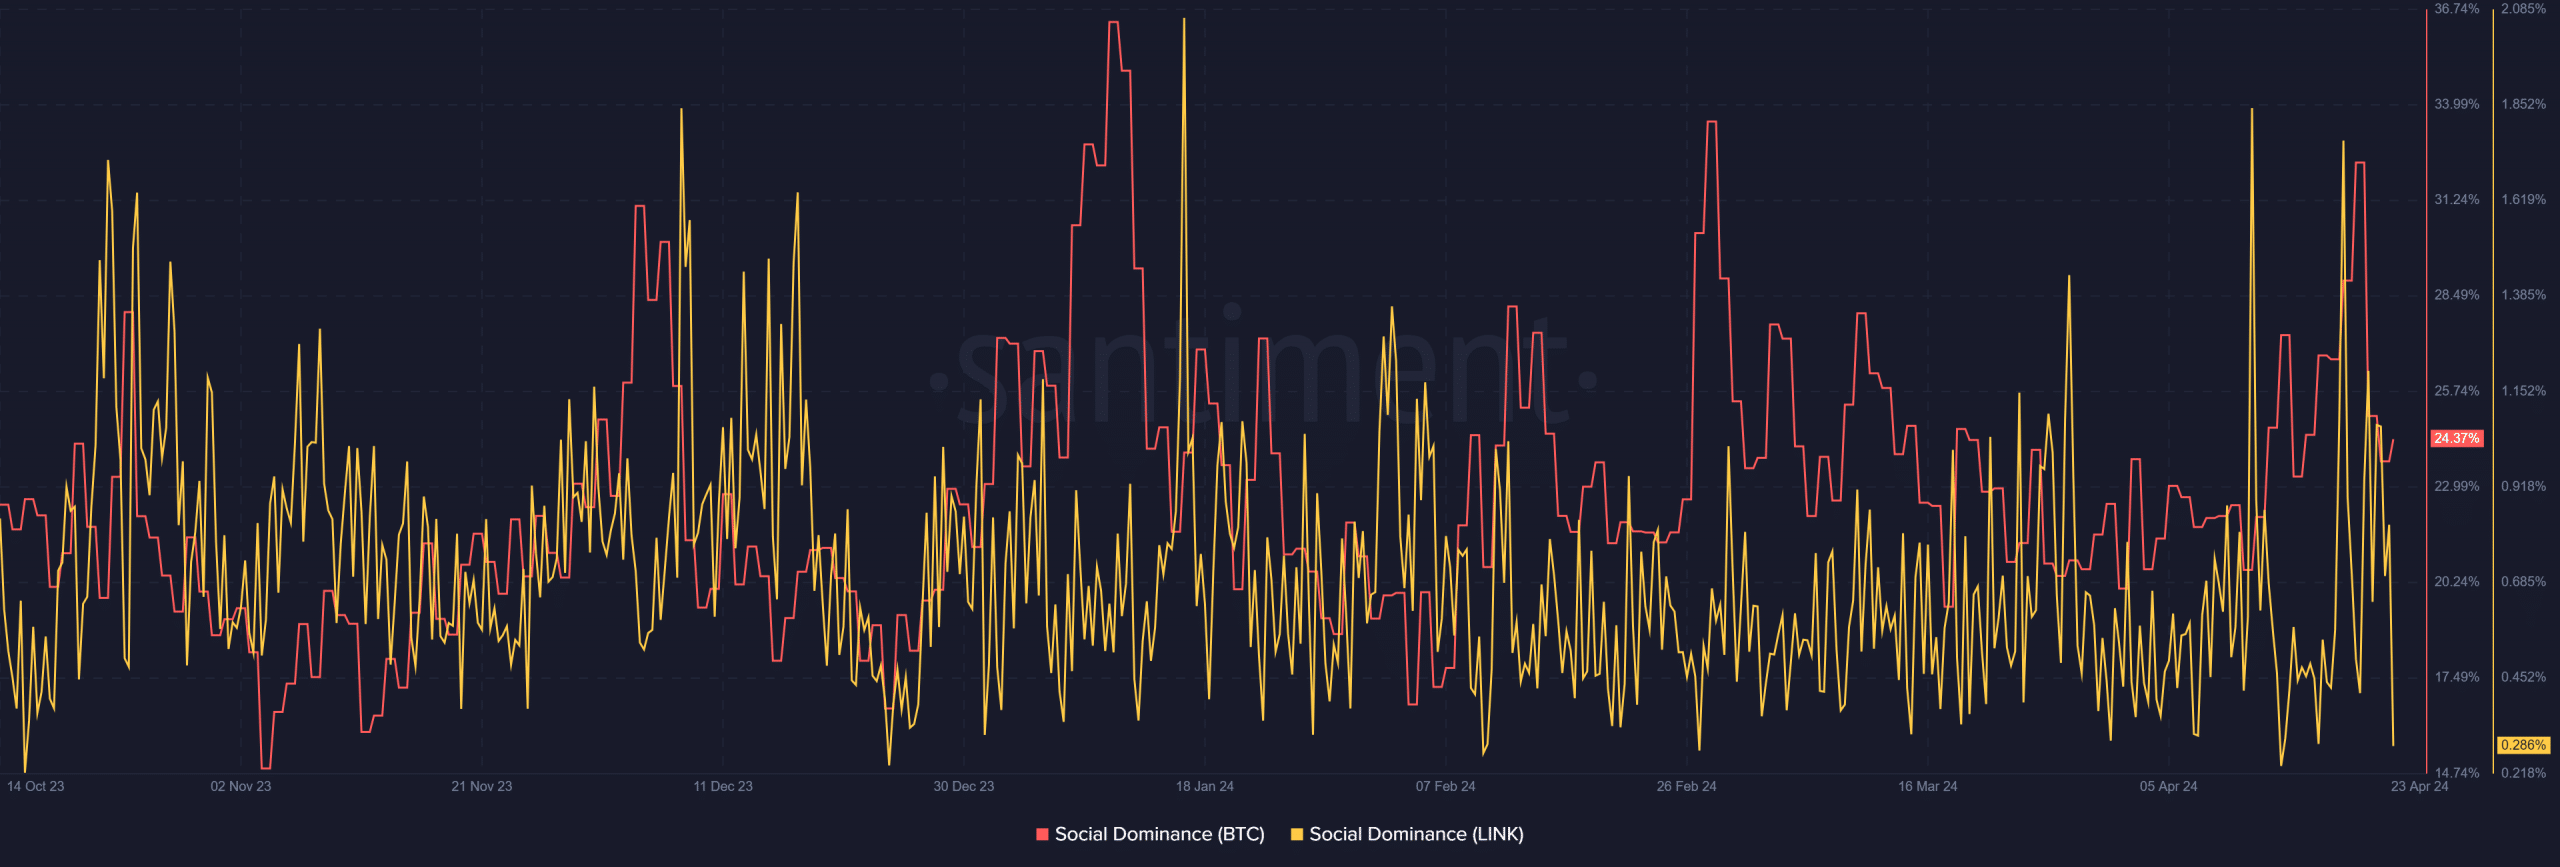
Additionally, examining the social dominance metric revealed that Bitcoin had over 25%. In comparison, Chainlink had less than 1% at the time of writing. This metric illustrates the percentage of discussions each asset occupies within the broader cryptocurrency discourse.
Reason for the increased social activity
AMBCrypto’s analysis of the daily timeframe charts for Bitcoin and Chainlink sheds light on the recent surge in their social metrics. BTC and LINK have exhibited upward trends over the past few days, albeit to varying extents.
Analyzing the Chainlink chart reveals a consistent uptrend over the last six days. Starting on 18th April, with an increase of over 5%, LINK traded at around $13.89.
By the end of trading on 22nd April, the price had risen to $15.46, marking a 2.3% climb. As of the time of writing, it was trading at approximately $15.38, experiencing a minor decline of less than 1%.
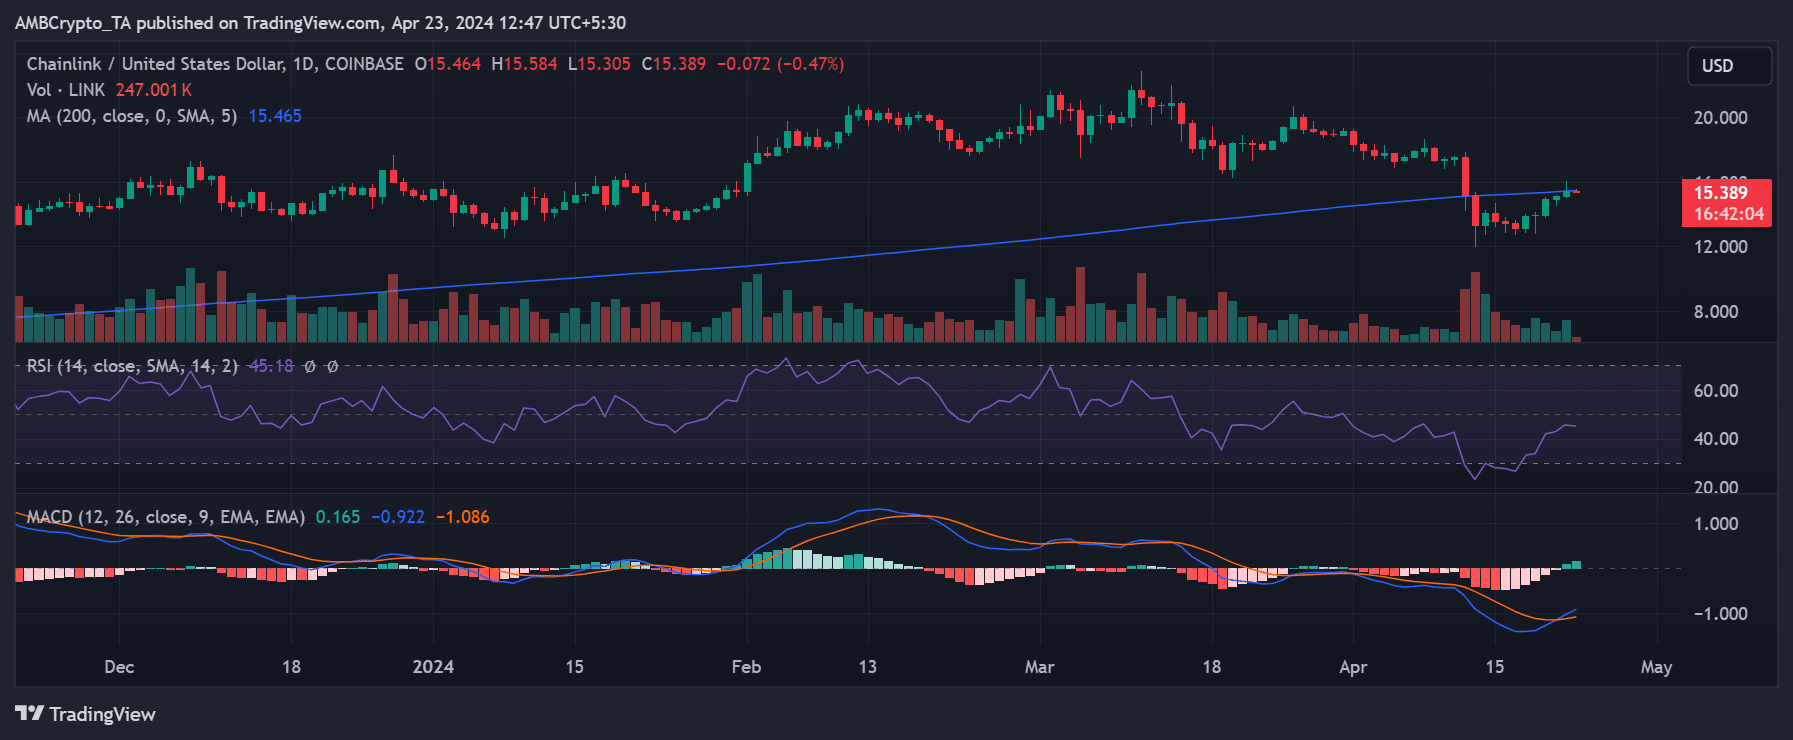
Source: TradingView
Similarly, Bitcoin’s chart suggests a comparable trend, although a slight decline on 21st April interrupted the consecutive uptrend. Bitcoin saw an increase of over 3.8% on 18th April, trading at around $63,513.
By the close of trading on 22nd April, it had risen to around $66,859, reflecting an almost 3% increase.
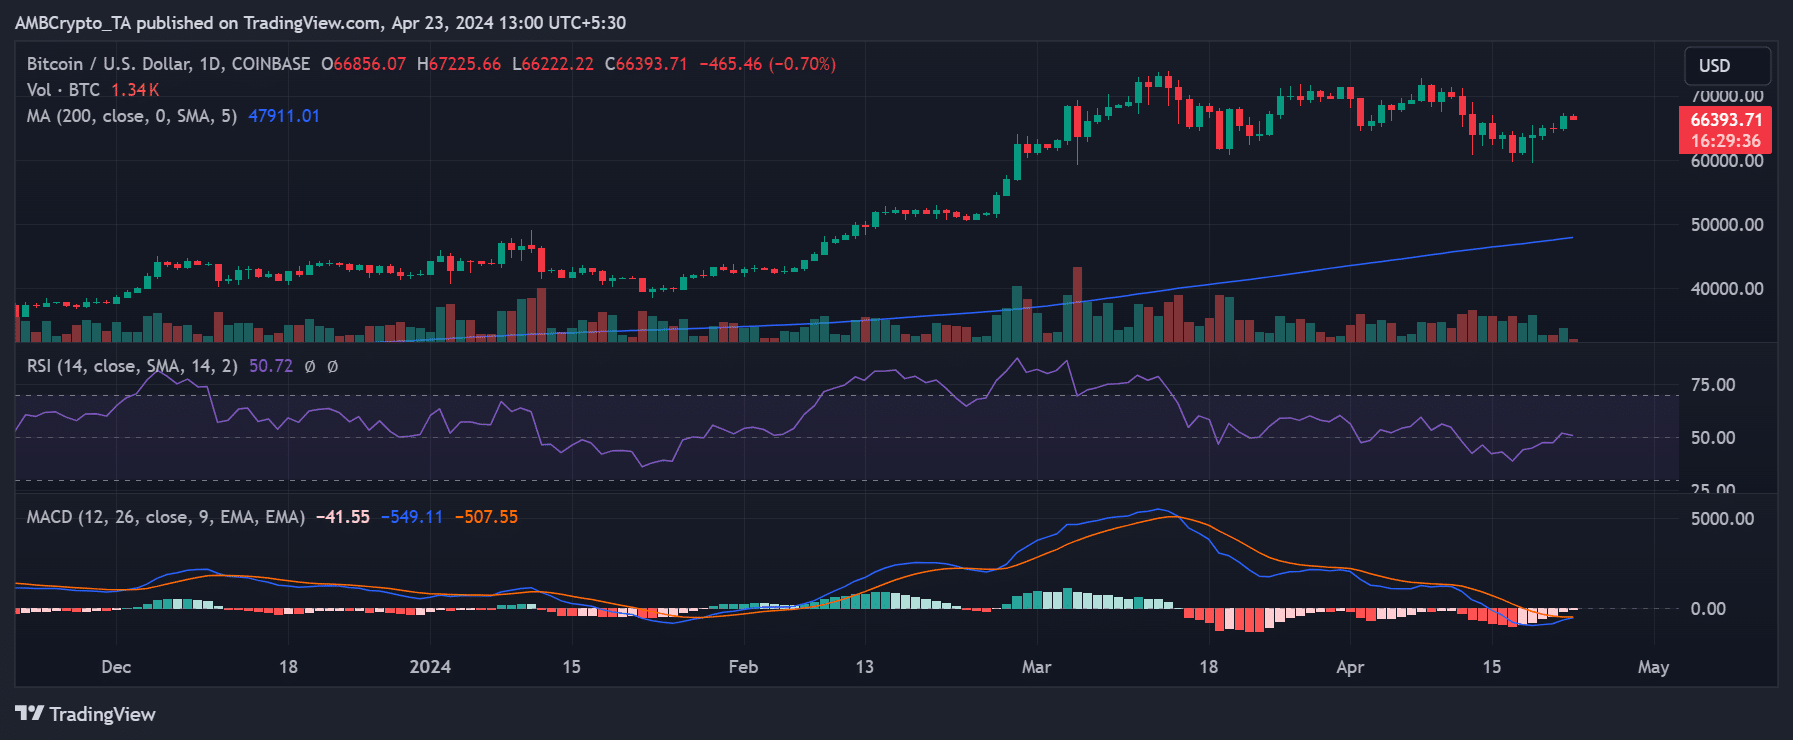
Source: TradingView
Realistic or not, here’s LINK market cap in BTC’s terms
At the time of this writing, BTC was trading at around $66,250, with a less than 1% decline.
The consecutive price rises and the attempts by both BTC and LINK to break into new price ranges have garnered significant attention, leading to the observed surge in social activity surrounding these assets.

 Trial, and CZ’s Sentencing: This Week’s Crypto Recap")