

Despite being a market leader in the oracle space, Chainlink (LINK) is showing signs of stagnation compared to newer, more dynamic competitors like Pyth Network (PYTH). Analyzing their market responsiveness and correlation with Bitcoin reveals a stark contrast in their potential to reach previous all-time highs. This article explores why LINK may struggle to achieve its ATH again and how Pyth’s market dynamics position it for significant growth.
Introduction to oracle networks
Blockchains are closed systems that only know what is recorded on their own chain, but many applications require data from the “outside world.” Oracles fill this gap by bringing off-chain information onto the blockchain, allowing smart contracts to interact with real events and market changes.
Without oracles, smart contracts would be limited to using only on-chain data, severely restricting their practical applications. By providing access to external data, oracles significantly expand the capabilities of blockchain technology. They make possible complex applications like crypto-backed loans that adjust to market prices or insurance policies with automated payouts based on weather events.
However, the main use case for oracles lies in providing price feeds. Without price feeds, smart contracts would lack real-time asset prices, leading to inaccurate or outdated data that drives decisions. This would make trading, lending, and borrowing unreliable, as transactions and contract executions wouldn’t reflect actual market conditions, destabilizing the entire ecosystem.
What are PYTH and Chainlink
Before exploring how PYTH’s price action might unfold in 2025, it’s important to understand what PYTH is and how it compares to its main competitor, Chainlink.
PYTH is a decentralized oracle network that provides high-frequency, low-latency financial data, particularly for the DeFi sector. It sources real-time data directly from top financial institutions and trading firms, making it highly reliable and accurate. Additionally, PYTH’s data is fully verifiable on-chain.
Chainlink, on the other hand, is a more established and versatile oracle network that has been in the market longer and serves a broader range of industries. While it also provides price feeds, Chainlink’s strength lies in its ability to integrate various types of off-chain data into smart contracts, making it applicable to sectors such as insurance, supply chain management, and gaming. Unlike PYTH, which focuses on speed and financial data accuracy, Chainlink offers a more generalized service.
Market position and supply dynamics
Supply overview
To evaluate Pyth Network’s future price, one must compare its position to that of Chainlink, which currently leads the oracle industry. While some believe PYTH could surpass Chainlink soon, maintaining a conservative approach offers a more realistic perspective.
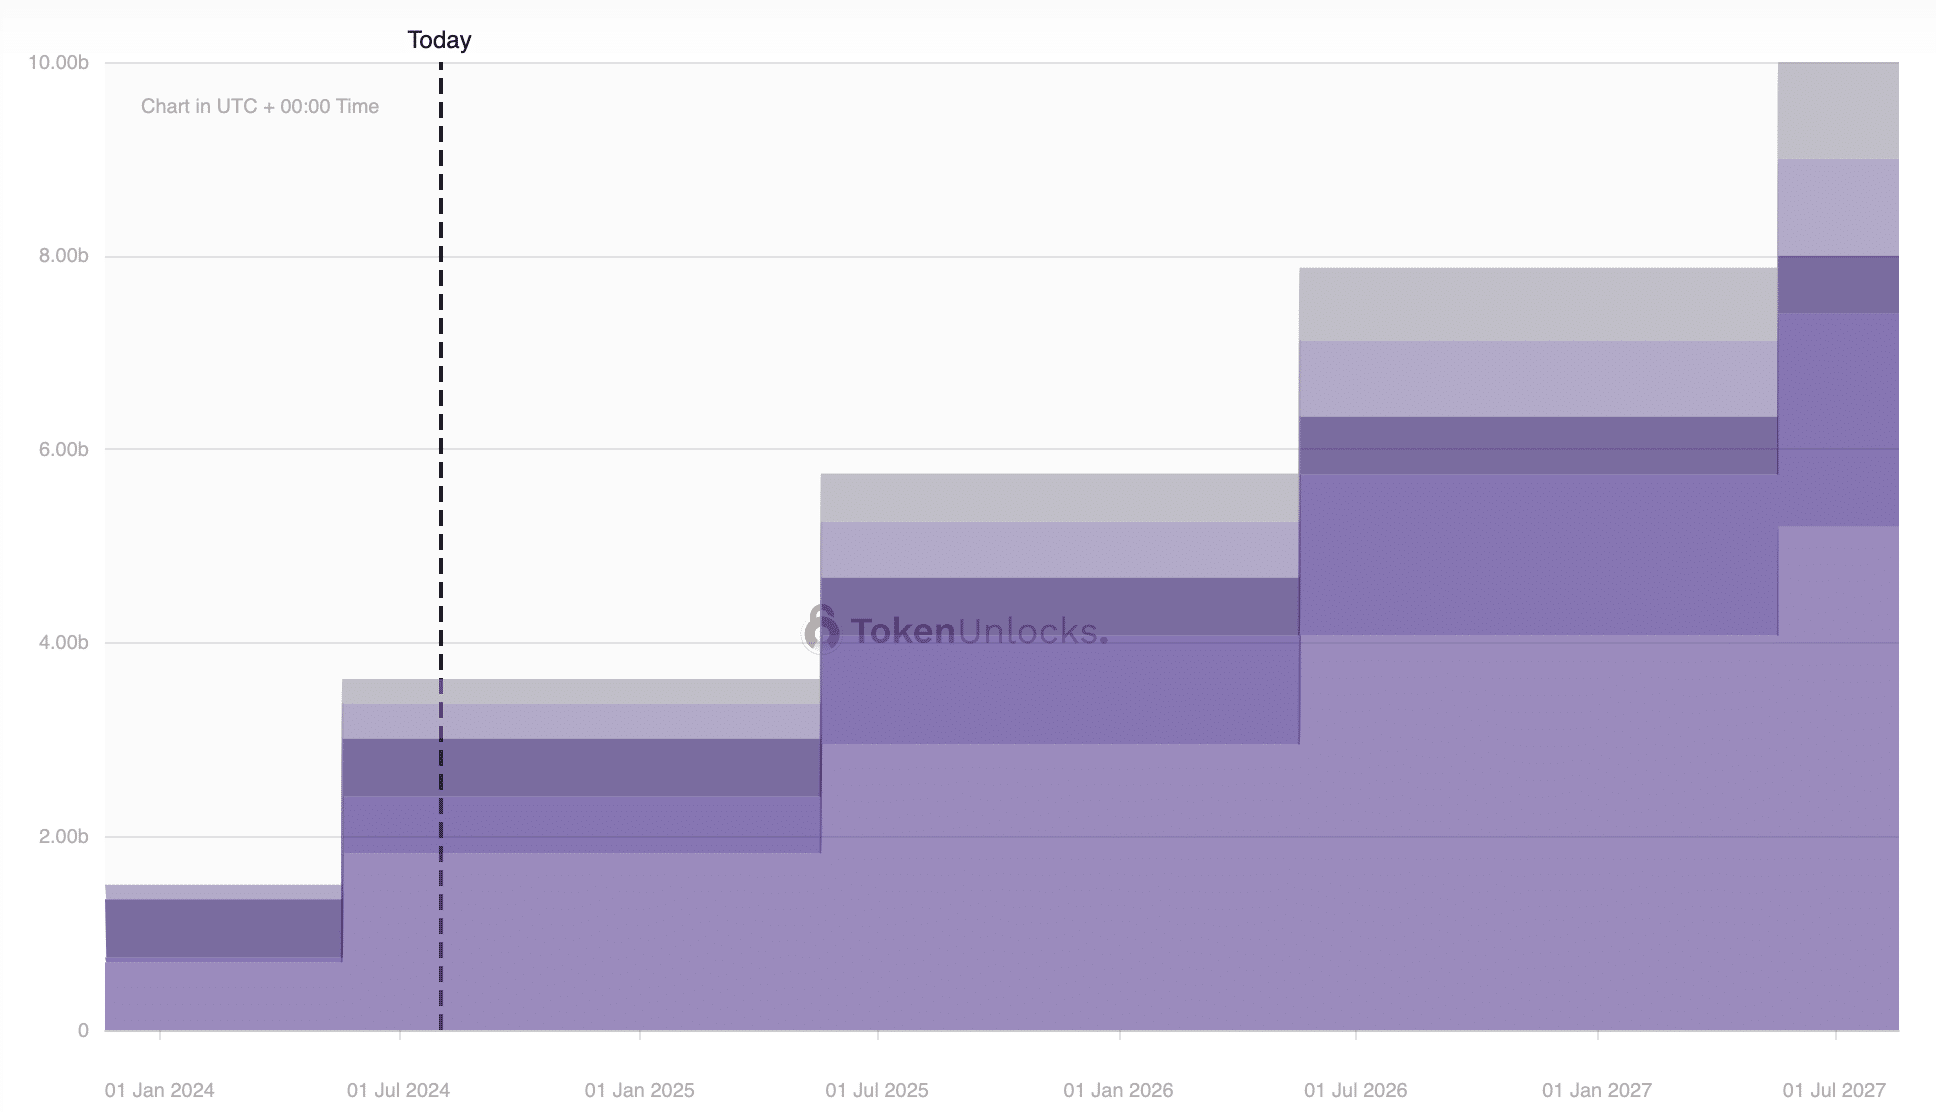
Regarding PYTH’s supply, it’s also important to focus on the supply during the peak of the 2025 bull market rather than on its unlock schedule. The next unlock is set for mid-2025, likely after the bull market has peaked. As of July 2024, PYTH has a circulating supply of 3,624,988,892 tokens, and this amount will remain unchanged until May 2025.
Chainlink, in contrast, has a dynamic supply due to the variable staking rewards rate, which was 4.32% as of July 31, 2024. However, the actual inflation rate tells a different story. Since the last unlock in September 2023, the LINK circulating supply increased from 556,850,000 to 608,099,970 in just ten months, representing a 9.2% inflation rate.
By projecting this trend forward, the expected Chainlink supply by May 2025, just before PYTH’s next unlock, would reach approximately 664,045,167 LINK.
Historical price and supply correlation
An increasing supply can dilute the value per token due to inflation. For PYTH, this isn’t a concern until the next unlock. However, it is important to note that when the unlock occurs in May 2025, PYTH will release 2.125 billion PYTH, diluting the current supply by over 58%.
But as mentioned earlier, Chainlink’s supply is inflationary. Since its last all-time high of $52.88 on May 10, 2021, the circulating supply has increased by more than 43%. At that time, its market cap peaked at $22.48 billion. To reach that same market cap with the projected 2025 supply, Chainlink would need to achieve a price of approximately $33.85 per token.
| Year | Supply | Market Cap | Price at ATH Market Cap |
|---|---|---|---|
| 2021 | 425,009,554 LINK | $ 22.48B | $ 52.88 |
| 2025 | 664,045,167 LINK | $ 22.48B | $ 33.85 |
Market cap analysis
At the start of 2024, PYTH represented a modest portion of Chainlink’s market cap. On January 1, 2024, PYTH’s market cap stood at $535 million, capturing only 6% of Chainlink’s market cap, which was $8.826 billion. However, this ratio began to shift significantly as the year progressed.
By March 2024, PYTH’s market cap had surged to $1.73 billion, representing 14.83% of Chainlink’s $11.64 billion market cap. Despite market fluctuations and a general cooling down, PYTH maintained its higher share of Chainlink’s market cap. As of July 31, 2024, PYTH’s market cap is $1.28 billion, or 16.37% of Chainlink’s $7.8 billion.
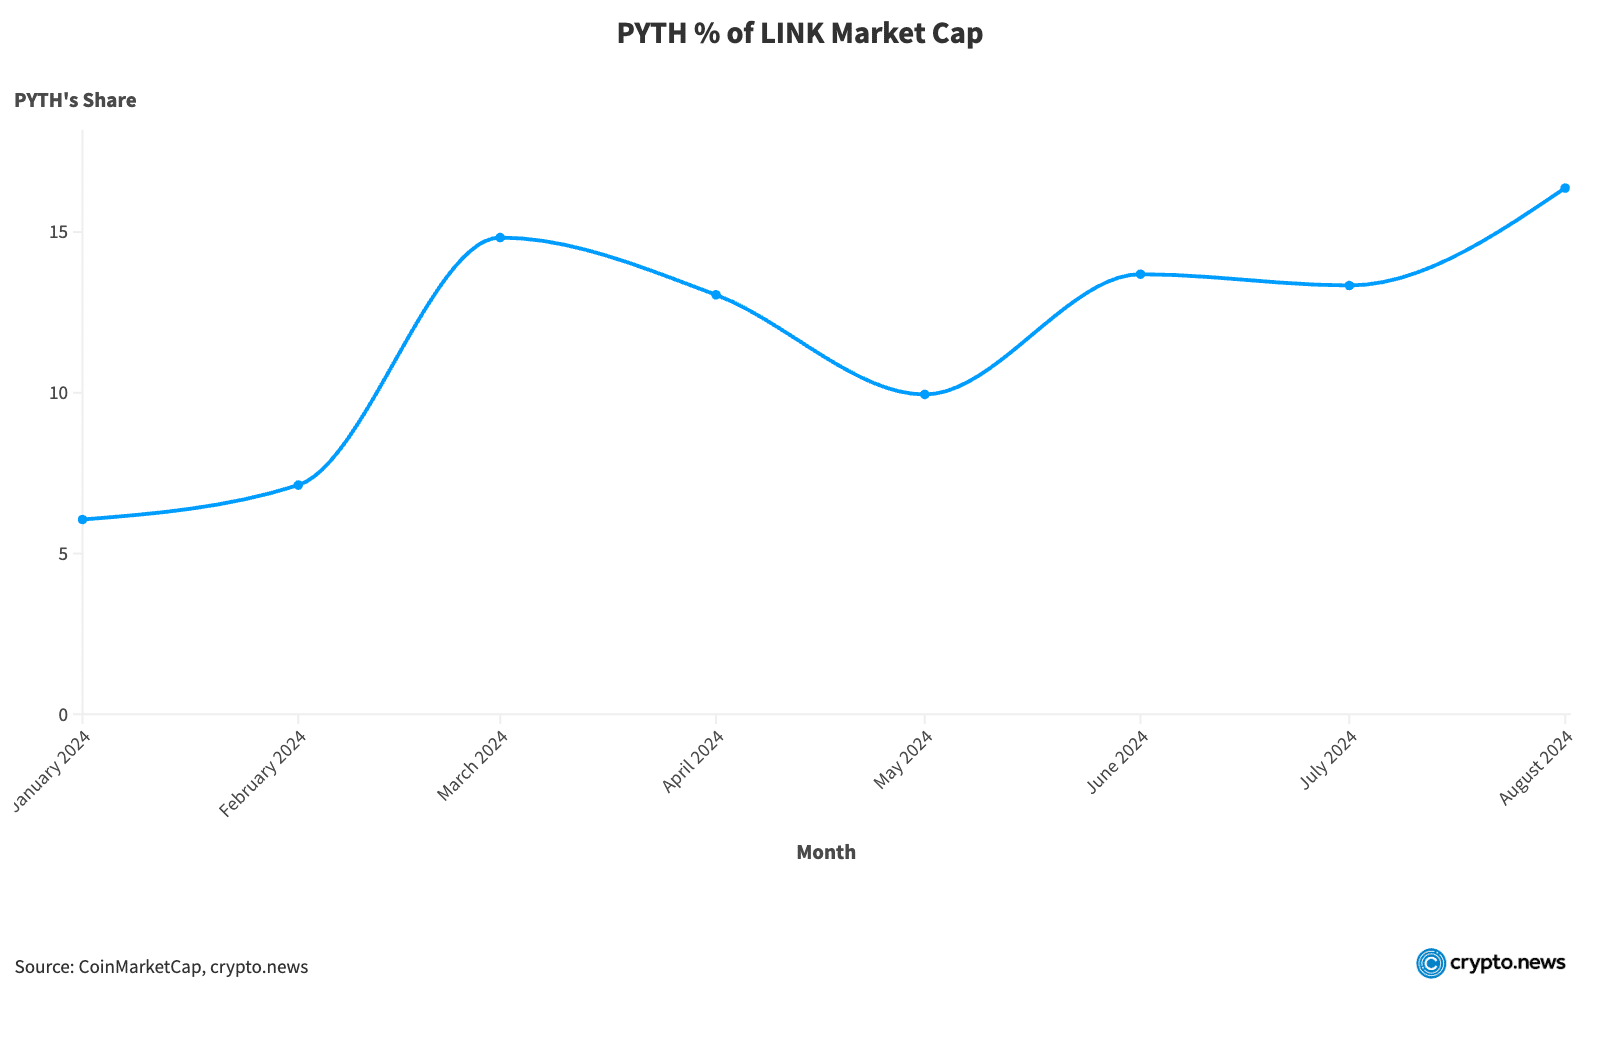
The trend suggests that PYTH is steadily gaining ground on Chainlink, which could have significant implications for its future positioning within the oracle market. This data will become even more relevant as the analysis delves deeper into PYTH’s future price action and market dynamics.
Adoption and performance
dApps
Chainlink dominates the oracle market. It secures 400 out of 787 dApps across the top 10 oracle networks, representing over 50% market share. In contrast, PYTH controls 205 dApps, accounting for about 26% of the market. Despite its later entry, PYTH has rapidly gained market share since launching its mainnet in August 2021. Chainlink, however, entered the market in 2019, giving it a two-year advantage. Given PYTH’s strong growth trajectory, it will likely continue gaining market share and expanding its industry presence.
Total Value Secured
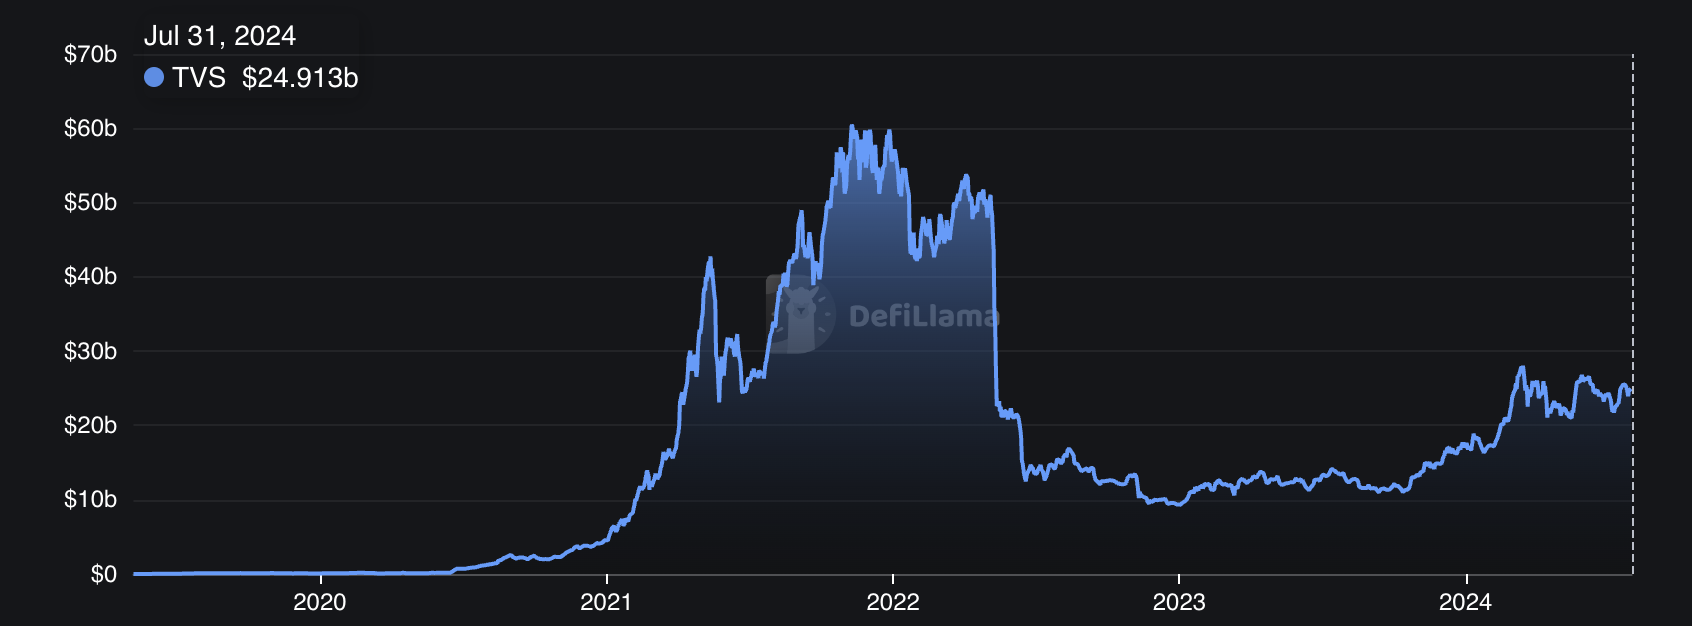
Total Value Secured (TVS) represents the total amount of assets or financial value that an oracle network safeguards through its data feeds. This metric serves as an important benchmark in the comparison of different oracle networks because it reflects the trust and reliance that decentralized applications (dApps) and smart contracts place on the network. A higher TVS indicates broader adoption and greater confidence in the oracle’s ability to provide accurate and secure data.
As of July 2024, Chainlink leads the oracle market with $24.91 billion in total value secured. However, this figure is a significant decline from its peak of $60.5 billion in November 2021. The stagnation in Chainlink’s TVS since then suggests that its growth has slowed despite its established position in the market.
In contrast, Pyth has shown impressive growth, continually reaching new all-time highs in its TVS, which is currently at $5.31 billion.
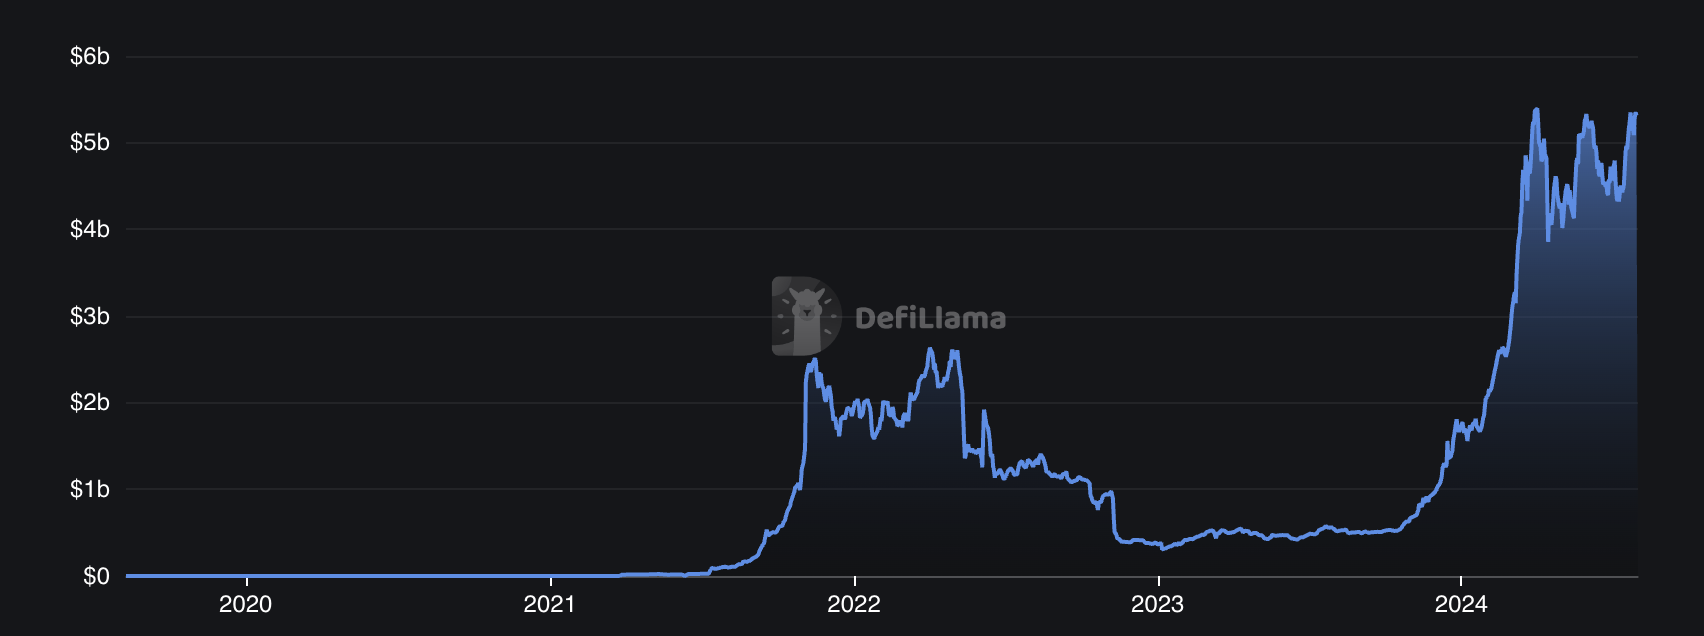
While the difference between Chainlink and Pyth remains substantial—nearly a 5x gap—Pyth’s rapid growth raises questions about whether it could eventually surpass Chainlink in securing value. Nevertheless, Chainlink remains the dominant player in the oracle space, and given its extensive adoption and established infrastructure, it is likely to retain its leadership position through 2025.
Price feeds and supported blockchain networks
While Chainlink has steadily built its network over five years, now supporting 132 price feeds across 19 blockchains, PYTH has taken a more aggressive growth approach.
Starting with just Solana in August 2021, PYTH rapidly expanded its reach. By its first anniversary, PYTH had already implemented 83 price feeds.
The growth of PYTH continued steadily, with 322 feeds on 30 blockchains by July 2023 and 551 price feeds across 70 blockchains by July 2024.
To put it simply, it means PYTH has effectively doubled its coverage each year since its inception. In doing so, it has quickly surpassed Chainlink in both the number of price feeds and the breadth of blockchain support.
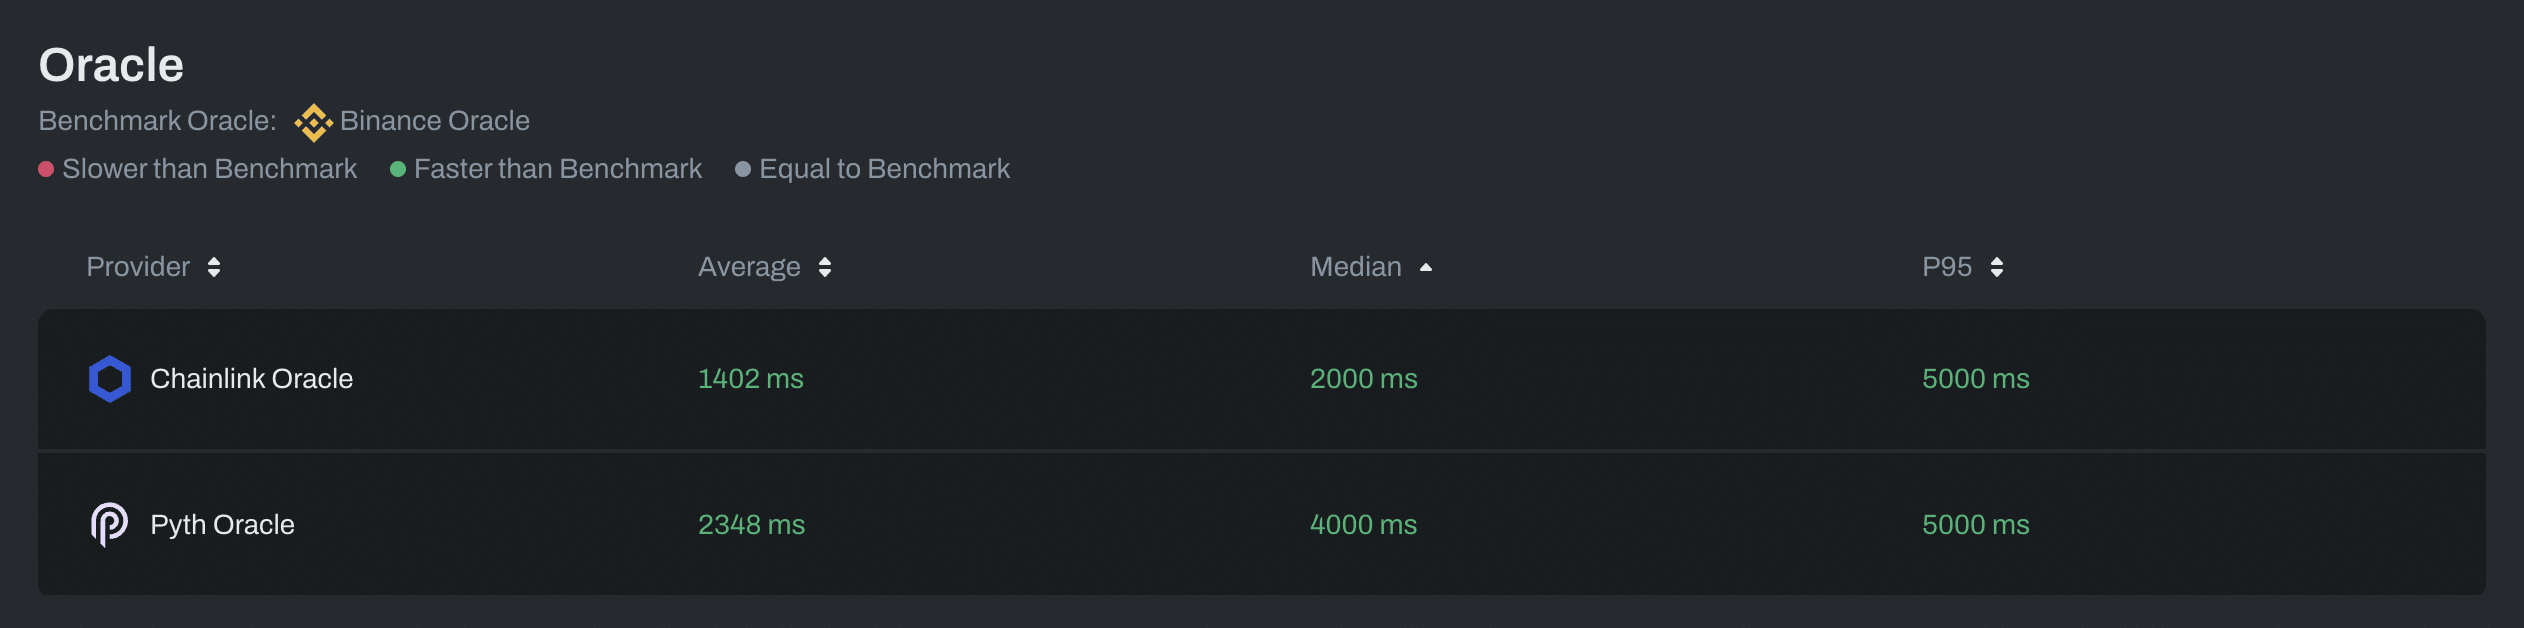
Latency
PYTH claims a latency of 400 milliseconds, while Chainlink describes its speed as sub-second without specifying the exact timing. However, data from the Chaos Labs’ oracle dashboard shows a different picture. Over the last 30 days, Chainlink’s average latency was 1,402 milliseconds, whereas PYTH’s average latency was 2,348 milliseconds, making PYTH slower in practice.
Another important metric is price deviation from the benchmark. For the same period, Chainlink’s average deviation was 0.034%, while PYTH’s was slightly higher at 0.0335%.
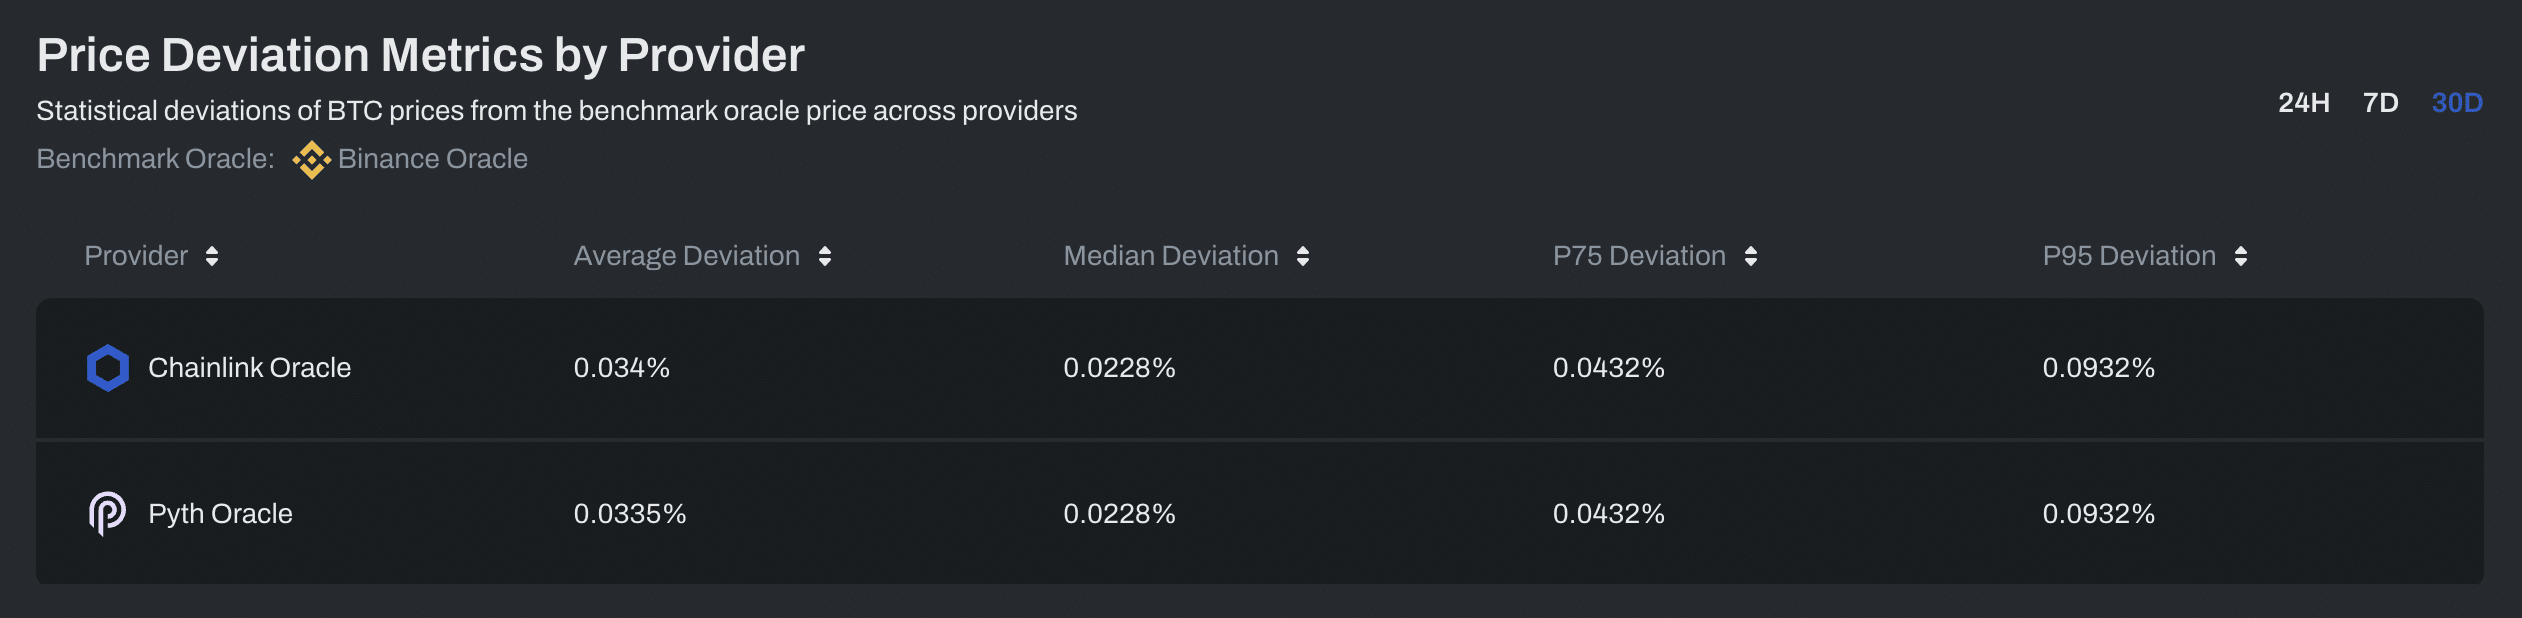
This suggests that, despite PYTH’s position on Solana offering theoretical speed advantages, Chainlink’s longer presence in the market has allowed it to optimize performance and maintain a strong position as a reliable oracle provider.
Main Takeaways: PYTH vs. Chainlink
Given the analysis so far, we can highlight several key points:
- PYTH’s supply will remain static at 3,624,988,892 tokens until May 2025, which is likely after the bull market peak.
- Chainlink’s supply is inflationary, with a projected supply of 664,045,167 LINK by May 2025.
- The PYTH/LINK market cap has grown from 6% to 16.37% between January and July 2024.
- Chainlink dominates in secured dApps (50% market share) and Total Value Secured ($24.91 billion) and maintains better performance in latency (1,402ms vs. PYTH’s 2,348ms) and price deviation. On the other hand, PYTH surpasses Chainlink in price feeds (551 vs. 132) and supported blockchains (70 vs. 19).
- A “flippening” is unlikely by 2025.
Market Behavior and Price Movements
Relying solely on historical performance or fractals does not reliably predict asset price movements. However, analyzing past behavior can provide insights into how assets respond during market fluctuations.

To understand PYTH and Chainlink’s responsiveness to market conditions, we conducted a Pearson correlation coefficient analysis between PYTH-BTC and LINK-BTC. We chose BTC as a benchmark because crypto markets often move in tandem with Bitcoin, which frequently acts as the main catalyst for market movements.
The Pearson correlation coefficient measures the strength and direction of the linear relationship between two variables. The coefficient ranges from -1 to 1, where -1 indicates a perfect negative correlation, 0 signifies no correlation, and 1 represents a perfect positive correlation.
Results revealed that PYTH has a correlation of 0.4519 with BTC, which indicates a moderate positive relationship. In other words, PYTH tends to move in line with Bitcoin and reacts to broader market trends.
The correlation between LINK and BTC was 0.2235, which shows a relatively weak relationship. LINK does not consistently follow BTC’s movements and behaves more independently of the overall market.
This correlation pattern, combined with the consistent circulating supply dilution, suggests Chainlink is unlikely to reach its previous all-time high of $52.88. While assets like BTC and PYTH have reached new all-time highs, and others like ETH and SOL have come within 30% of their previous peaks, assets not in this range may be considered underperforming in the current market.
Some may argue that Chainlink is prospering and holding leading positions, which is true for the project itself. However, from an investment perspective, the LINK token appears less attractive than other assets in the market.
PYTH Price Prediction: Can PYTH Reach $2?
Considering the arguments that suggest LINK may not reach its previous all-time high in the 2025 bull market and noting its March 2024 peak of $22.83, we can project bear, base, and bull case scenarios for Chainlink’s price at $30, $40, and $50 respectively.
With a projected LINK supply of 664,045,167, these price targets would result in market capitalizations of:
| Bear | Base | Bull | |
|---|---|---|---|
| LINK Price | $ 30 | $ 40 | $ 50 |
| Market Cap | $ 19,921,355,010 | $ 26,561,806,680 | $ 33,202,258,350 |
Currently, PYTH’s market cap represents 16.37% of LINK’s. If this ratio remains constant, PYTH’s price would be:
| Bear | Base | Bull | |
|---|---|---|---|
| PYTH Price | $ 0.9 | $ 1.2 | $ 1.5 |
| Market Cap | $ 3,261,125,815 | $ 4,348,167,753 | $ 5,435,209,691 |
However, we anticipate PYTH’s market dominance to increase, potentially representing 30-50% of LINK’s market cap. Using these projections:
- Bear case (16.37% share): $0.9 to $1.5
- Base case (30% share): $1.65 to $2.75
- Bull case (50% share): $2.75 to $4.58
The base case scenario of a 30% market cap share appears most likely, suggesting a price target of approximately $2 for PYTH in 2025.
Disclosure: This article does not represent investment advice. The content and materials featured on this page are for educational purposes only.


