

Bitcoin mine characteristics
The study period for our analysis was August 2022 to July 2023. Our sample included 34 Bitcoin mines in the U.S., with an aggregate capacity of 3,910 megawatts (MW). The U.S. Energy Information Administration (EIA) estimated that as of March 2023, the total power capacity of all 137 Bitcoin mines in the U.S. was 3,000-4,000 MW11. Therefore, our sample of 34 Bitcoin mines represented the largest power capacity mines in the U.S. (see Supplementary Information). The mines in our sample ranged in capacity from 38 MW (CleanSpark; College Park, GA) to 450 MW (Riot Digital; Rockdale, TX), and the median mine capacity was 100 MW (Table 1).
We estimated that these mines consumed 32.3 terawatt-hours (TWh) of electricity during the study period after accounting for periods when the mines were offline (see Supplementary Information for details). The electricity usage of these 34 mines would equal the annual demand of three to six million homes12.
The Bitcoin mining company Core Scientific operated more mines (seven mines with 814 MW aggregate capacity) than any other company. Mines were located in 15 U.S. states (Fig. 1). Ten mines were in Texas—more than in any other state—including three of the four mines in our sample with capacities of at least 200 MW. New York and Georgia hosted four mines each, while Pennsylvania and North Dakota each hosted three. No other state had more than one mine.
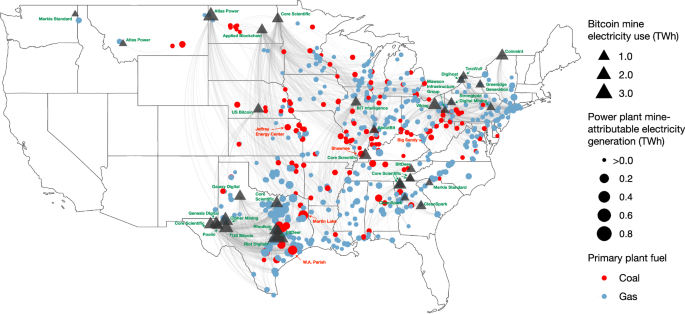
1 Electricity use in terawatt-hours (TWh) for each of the 34 mines in our sample is based on each mine’s confirmed capacity during the study period and the estimated percentage of time during the study period that the mine operated at full capacity, i.e., its uptime. These are lower-bound estimates. Some mines may have increased their capacity (and thus their electricity use) beyond their confirmed capacity during the study period. 2 Gray lines connect Bitcoin mines to the fossil fuel-fired power plants that generate additional electricity in response to each mine’s additional electricity consumption. They are based on the grid balancing authority in which each mine is located, and they also account for instances in which electricity is transferred between balancing authorities. Renewable generating plants (e.g., solar, hydro, wind) that respond to Bitcoin mine demand are not listed because they do not emit PM2.5 pollution. Responding power plants are often hundreds of miles from Bitcoin mines. 3 Each power plant’s mine-attributable electricity generation is the total electricity in TWh that each power plant generated during the study period in response to the electricity consumed by the Bitcoin mines. Maps were generated using the ggplot2 (v3.5.1; DOI: 10.32615/CRAN.package.ggplot2) and tigris (v2.1; DOI: 10.32614/CRAN.package.tigris) packages in R.
Bitcoin mine-associated power plants
Each Bitcoin mine was located within a geographic area—a “balancing authority region”—where electricity generation is constantly calibrated to match electricity consumption13. There are 66 such regions in the contiguous U.S., varying in size from thousands to millions of square miles. When a Bitcoin mine begins operations or increases capacity, it demands more electricity, and power plants within the mine’s balancing authority region must respond to this increased “marginal” demand by increasing the electricity it generates. Within each balancing authority region, some power plants will generate proportionately more electricity than others in response to increased demand. The relative contribution of each power plant in response to increased marginal demand is determined by several factors, including power plant fuel type and capacity, and whether renewable electricity sources are available.
We estimated how much electricity the 635 individual power plants generated in response to consumption by each of the 34 Bitcoin mines during the study period using data from the EIA and the U.S. Environmental Protection Agency (EPA) and regression models from WattTime. See Supplementary Information for details. Fossil fuel power plants generated 85% of the increased electricity demand from Bitcoin mines, including 138 coal-fired and 497 natural gas-fired plants. Bitcoin mines and the power plants that increased generation in response to them were often separated by multiple states and hundreds of miles (Fig. 1). For example, electricity consumed by the Atlas Power Bitcoin mine in Williston, ND, induced a large response from the Jeffrey Energy Center coal-fired power plant located 722 linear miles and three states away in St. Marys, KS (Table 1).
Bitcoin mine-attributable power plant emissions
After establishing the amount of electricity each power plant generated in response to each Bitcoin mine’s electricity use, we quantified the PM2.5 and CO2 emissions from each plant that were attributable to Bitcoin mining operations using data from the U.S. EPA (see Supplementary Information). Table 1 reports Bitcoin mine-attributable power plant PM2.5 emissions for the 10 mines in our sample responsible for the largest amount of primary PM2.5 emissions. See Supplementary Information for results from all 34 mines.
Mine electricity consumption, PM2.5 emissions, and CO2 emissions were only loosely correlated because the mix of power plants that responded to each mine’s electricity demand was often different, and some plants emitted more PM2.5 and CO2 per TWh than others. For example, the Core Scientific mine in Calvert City, KY, was responsible for more PM2.5 emissions than any other mine despite ranking 8th in electricity consumption and 11th in attributable CO2 emissions (Table 1). This discrepancy is partly because the Calvert City Core Scientific mine induced a large response from the Shawnee Fossil Plant in West Paducah, Kentucky, which is a coal-fired plant with fewer pollution control than similar plants. The Shawnee Fossil Plant also responded to electricity consumed by the BitDeer mine in Knoxville, TN, which, despite ranking 24th in electricity consumption, was responsible for the 4th highest PM2.5 emissions (Table 1).
Environmental impact of Bitcoin mine-attributable PM2.5 air pollution
Power plants emit several air pollutants, including PM2.5 emitted directly from their stacks (i.e., “primary” PM2.5), NOx, and SOx. Once airborne, NOx and SOx can react in the atmosphere to form additional (i.e., “secondary”) PM2.5 pollution14. To assess ambient (i.e., primary and secondary) PM2.5 air pollution across the U.S. attributable to Bitcoin mines, we used the InMAP model, which is a validated, computationally efficient, reduced complexity chemical transport model developed to trace air pollution from specific sources15. See the Methods section below for details. InMAP predictions have been validated against more complex chemical transport models as well as EPA ground monitoring data. Model performance is within published standards15. We aggregated all InMAP model estimates of total Bitcoin mine-attributable ambient PM2.5 air pollution to the Census tract level, mapped the resulting concentrations, and quantified the number of people exposed to it.
Extensive prior research demonstrates that even small increases in long-term PM2.5 air pollution increase the risk of premature mortality and other adverse health outcomes16,17,18. We estimated that 46,211,621 Americans living in 27 states were exposed to measurable (i.e., ≥0.01 µg/m3 on average) concentrations of Bitcoin mine-attributable PM2.5 pollution from August 2022 through July 2023 (Fig. 2). This exposure was in addition to PM2.5 pollution attributable to all other sources. Americans exposed to Bitcoin mine-attributable pollution lived in regions extending west to Montana, east to New York, and south to Texas. Both rural and urban regions were affected, including densely populated areas in or near New York City; Houston, Austin, and San Antonio, Texas; New Orleans and Shreveport, Louisiana; Little Rock, Arkansas; St. Louis, Missouri; Evansville, Indiana; Nashville, Tennessee; Atlanta, Georgia; and Greensboro and Charlotte, North Carolina.
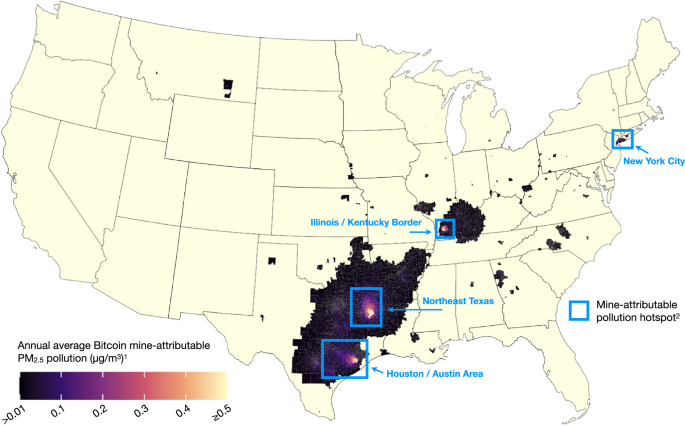
1 Mapped are annual average ambient PM2.5 concentrations attributable to the 34 Bitcoin mines in our sample. Thus, these are estimates of marginal (i.e., additional) pollution attributable to Bitcoin mine electricity use, not estimates of total air pollution from all sources. Estimates are from the InMAP model and account for (1) primary PM2.5, NOx, and SOx emissions from specific power plants responding to increased demand for electricity induced by Bitcoin mines; (2) power plant attributes (e.g., location, stack height); and (3) meteorology. Polluted census tracts (i.e., tracts displayed in any color other than the pale-yellow base color) are those with average annual mine-attributable PM2.5 concentrations of at least 0.01 μg/m3. Tracts in bright yellow may exceed 0.5 μg/m3. See Table 2. 2 Blue squares approximate the 4 mine-attributable PM2.5 “hotspots.” Hotspots are empirically defined as contiguous counties containing at least one census tracts with an ambient Bitcoin mine-attributable PM2.5 concentration ≥ 0.10 μg/m3. See Fig. 3. Maps were generated using the ggplot2 (v3.5.1; DOI: 10.32615/CRAN.package.ggplot2) and tigris (v2.1; DOI: 10.32614/CRAN.package.tigris) packages in R.
We further estimated that 1,904,959 Americans across five states were exposed to Bitcoin mine-attributable PM2.5 concentrations of at least 0.10 µg/m3 on average across the study period. Most of these residents lived in 1 of 4 “hotspots,” which we defined as contiguous counties containing at least one Census tract with a total mine-attributable PM2.5 concentration ≥0.10 µg/m3 (Fig. 2). These are (1) New York City, (2) the Houston/Austin metropolitan area, (3) Northeast Texas, and (4) areas along the Illinois/Kentucky border (Fig. 3). Moreover, within each hotspot, Bitcoin mine-attributable PM2.5 concentrations in at least some tracts exceeded 0.50 µg/m3.
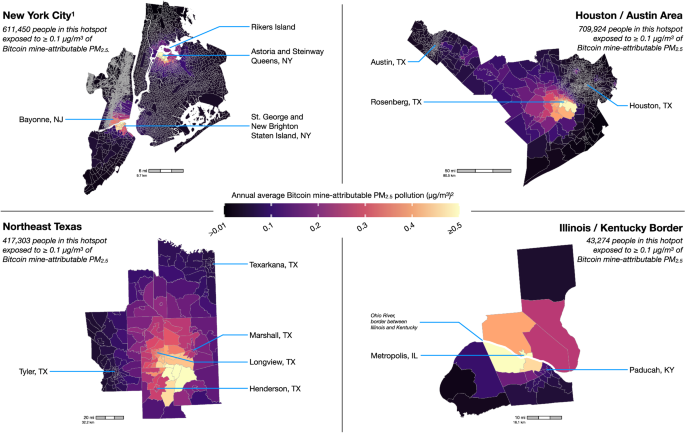
1 Mapped are U.S. census tracts (2020 Census borders) within hotspots. Hotspots are empirically defined as contiguous counties containing at least one census tract with a total (i.e., primary and secondary) Bitcoin mine-attributable PM2.5 concentration ≥0.10 μg/m3. A fifth hotpot matching this definition near San Antonio, TX, is excluded because it is considerably smaller and its Bitcoin mine-attributable PM2.5 concentrations are considerably lower than those in the four hotspots detailed here. See Table 2 for specific concentrations in selected hotspot census tracts along with a list of power plants and Bitcoin mines primarily responsible for the Bitcoin mine-attributable PM2.5 pollution. 2 Estimates are from InMAP. They represent the additional ambient PM2.5 pollution that is attributable to Bitcoin mines. See Fig. 2. While the power plants emitting this pollution are often near or within the hotspots, the Bitcoin mines ultimately responsible for the emissions are typically hundreds of miles away. Maps were generated using the ggplot2 (v3.5.1; DOI: 10.32615/CRAN.package.ggplot2) and tigris (v2.1; DOI: 10.32614/CRAN.package.tigris) packages in R.
While many residents in these hotspots lived near fossil fuel power plants, the Bitcoin mines ultimately responsible for the additional mine-attributable PM2.5 pollution they inhaled were often hundreds of miles away. New York City, for example, had two primary areas exposed to high levels of mine-attributable air pollution (Supplement Section 7). Residents in the first area, at the northern end of Staten Island, were exposed to Bitcoin mine-attributable PM2.5 concentrations as high as 0.67 ug/m3, which accounted for 8.7% of all PM2.5 air pollution over the area (Table 2). Most of this pollution came from the Bayonne Energy Center gas-fired plant across the Kill van Kull in New Jersey. However, the Bitcoin mines ultimately responsible for these emissions were in upstate New York. For example, the Coinmint mine in Massena, New York, located near New York’s border with Canada and the 7th largest mine by capacity in our sample, was 100 linear miles away from Bayonne, New Jersey, and the pollution it was responsible for in Staten Island, New York.
The second area of exceedingly high mine-attributable PM2.5 pollution in New York City was in Queens, near the natural gas-fired Astoria Energy power plants. Here, the annual average of Bitcoin mine-attributable PM2.5 concentration reached 0.59 µg/m3. This area also includes the Rikers Island jail complex (0.46 ug/m3), which housed approximately 6000 prisoners and employed thousands more staff during the study period. Rikers Island has long been plagued by flooding, extreme heat, and poor air quality. Bitcoin-attributable PM2.5 adds yet another environmental exposure associated with adverse health outcomes.
We found two separate hotspots in Texas. The first stretched between Austin and Houston, with the highest Bitcoin mine-attributable PM2.5 concentrations near Houston’s southeast suburbs, including Sugar Land and Rosenberg (0.52 µg/m3). We estimated that 709,924 people were exposed to at least 0.10 ug/m3 of additional mine-attributable PM2.5 pollution in the Houston/Austin region, making it the largest hotspot by population. A large proportion of pollution in this hotspot came from the coal- and gas-fired W.A. Parish Generating Station (Richmond, Texas) and the Sam Seymour Power Plant (La Grange, Texas). While the Sam Seymour plant had SO2 scrubbers installed on two of its three stacks to reduce emissions, the W.A. Parish facility has no scrubbers on any of its four stacks, making its emissions particularly toxic. The human impact of this toxicity is multiplied by prevailing winds from the Gulf of Mexico, which blow toward the northwest and cause emissions from W.A. Parish to drift over more densely populated areas in this region19. Recent research estimated that emissions from the W.A. Parish plant led to 3500 (95% CI: 3200–3900) premature deaths among older adults in the U.S. from 1999 to 2020, largely before Bitcoin mining in Texas began16. Two years later, our analysis found that Bitcoin mining was responsible for additional PM2.5 — up to 0.5 µg/m3 — from W.A. Parish that was inhaled by residents in the Austin/Houston region. The Bitcoin mines ultimately responsible for this increased PM2.5 air pollution were located hundreds of miles west of Austin, including the Riot Digital mine in Rockdale, Texas, the Cipher Mining mine in Odessa, Texas, and the U.S. Bitcoin mine in McCamey, Texas.
These West Texas mines also increased electricity demand from plants in other parts of Texas. Thus, they were also responsible for increased mine-attributable PM2.5 pollution in the Northeast Texas hotspot, where additional annual average PM2.5 concentrations reached as high as 0.86 µg/m3 near Tatum, Texas, and made up 11.4% of all PM2.5 air pollution in the area (Table 2). Areas around Tyler, Longview, and Texarkana, Texas, were also affected. A substantial proportion of this mine-attributable PM2.5 pollution was emitted by the Martin Lake power plant (Tatum, Texas) and the Sandy Creek Energy Station (Riesel, Texas), both fueled by coal. However, compared to Sandy Creek, the Martin Lake facility is more extensive and has no SO2 scrubbers installed. From 1999 to 2020, emissions from Martin Lake were associated with 4100 (95% CI: 3700–4500) premature deaths among older Americans16. In our analysis, Bitcoin mines again increased the electricity demand—and thus hazardous air pollution emissions—produced by these fossil fuel power plants.
Another coal-fired plant—the Shawnee Fossil Plant in West Paducah, Kentucky—was responsible for a large proportion of Bitcoin mine-attributable PM2.5 pollution in the fourth hotspot along the Illinois/Kentucky border. This hotspot included the highest concentration of mine-attributable PM2.5 pollution anywhere in the U.S.: 0.96 µg/m3 in Metropolis, Illinois. We estimated that 13.1% of all PM2.5 air pollution over parts of Metropolis, Illinois, during the study period was attributable to Bitcoin mines (Table 2). The mines responsible for these emissions were spread across at least three states and included the BitDeer mine in Knoxville, Tennessee, the Core Scientific mine in Calvert City, Kentucky, and the Core Scientific mine in Marble, North Carolina.
The Core Scientific mine in Marble, North Carolina, illustrates the importance of mine location and electricity utility provider in determining the location and amount of Bitcoin mine-attributable PM2.5 pollution. Electricity for the Core Scientific mine was supplied by two separate utilities that were part of different balancing authorities. Specifically, 35 MW of the Marble mine’s 104-MW total capacity was supplied by TVA Murphy Power, which was balanced by the Tennessee Valley Authority (TVA). Marginal increases in electricity consumption within the TVA induced additional generation at the Shawnee Fossil Plant and thus increased mine-attributable PM2.5 pollution over the Illinois/Kentucky border. However, the Marble mine’s other 69 MW of capacity were balanced by Duke Energy Carolinas and thus induced electricity generation (and attendant pollution) at a different mix of power plants elsewhere.
Within each hotspot, we also explored possible Bitcoin mine-attributable PM2.5 exposure inequities. In many regions, socially marginalized groups experience higher air pollution exposure than others. In this study, we investigated whether Census tracts with higher proportions of non-White or low-income residents experienced higher levels of PM2.5 exposure from Bitcoin mining than tracts with more White or higher-income residents. We found no systemic exposure inequities in any of the four hotspots (see Supplement Section 2).
Sensitivity analyses
Our primary results rely on WattTime models to identify each power plant’s response to Bitcoin-induced marginal increases in electricity demand (Supplement Section 4). WattTime models account for several factors known to influence plant behavior and may outperform more simplistic models of grid response. Nevertheless, we performed two sensitivity analyses using alternative methods to estimate each power plant’s response to ensure our results are statistically robust. These sensitivity analyses suggest our primary, WattTime-based results are robust and appropriately conservative. See Supplement Sections 3.1 & 3.2. In a separate sensitivity analysis, we also found that the results reported above are consistent with those if we assumed that Bitcoin mines strategically manipulated their uptime to operate only during periods when electricity generation produced the lowest levels of emissions (Supplement Section 3.3).
Our analyses have some limitations. The InMAP model is computationally efficient, partly because it predicts concentrations at a finer spatial scale in more densely populated areas with higher pollutant concentrations. However, predictions in rural areas with lower pollutant concentrations may be less precise. Relatedly, InMAP output may generally underestimate concentrations from fossil fuel power plants across the United States, but they may somewhat overestimate predictions on the Gulf Coast of Texas and in Northeast Texas.
Policy Implications
Bitcoin mines, which are largely unregulated in the U.S., are an emerging and significant challenge to U.S. environmental health and air pollution regulation for two reasons. First, mining Bitcoin requires enormous amounts of electricity9. Bitcoin mines induce electricity production mainly from fossil fuel power plants, including from some of the country’s dirtiest coal-fired plants. This increased demand hinders policy efforts to retire fossil fuel power plants and reduce air pollutant emissions. Furthermore, additional Bitcoin mine-attributable PM2.5 emissions could slow efforts to attain the new National Ambient Air Quality Standard for PM2.5 of 9 µg/m3 recently announced in early 20242.
Second, air pollution regulatory efforts are further complicated because Bitcoin mines in one state often induce air pollution in other states, leaving residents in affected states with no state-based political power to reduce the Bitcoin mine-attributable air pollution they breathe. For example, residents in Metropolis, Illinois, breathe high concentrations of Bitcoin mine-attributable PM2.5 air pollution released from a power plant in Kentucky that supplies a Bitcoin mine in North Carolina. Yet, the Illinois state government has no jurisdiction to regulate activities in either Kentucky or North Carolina. As a result, federal regulation is required to address the impact of cross-state air pollution from the Bitcoin mining boom. One possible policy response may be for the U.S. EPA to promulgate a “Good Neighbor” rule for PM2.5 pollution that would require upwind states to control emissions from power plants more aggressively. A similar rule for ozone precursors has been proposed, but shifting interpretations of relevant law and EPA authority under the Clean Air Act may subvert these efforts. Alternative policy responses could encourage the responsible siting of Bitcoin mines to minimize negative environmental externalities and health burdens they impose.
Future Research
While this paper provides a foundation for understanding Bitcoin mining’s environmental impact, our estimates of the present impact of Bitcoin mining operations in the U.S. are very conservative for several reasons. First, our sample underrepresents the total number of U.S. Bitcoin mines. Second, the mines we examined have likely increased their power usage since the end of our study period in July 2023. For example, the BitDeer mine in Rockdale, Texas, is already more than 2.5 times larger than it was during the study period, and the global Bitcoin network hash rate (a measure of the computational power used to mine and process transactions on a cryptocurrency network) increased by 105% over the course of 202320. Furthermore, the state of Texas has seen a dramatic rise in its share of the U.S. Bitcoin mining hash rate, growing from 8.43% at the end of 2021 to 28.50% as of July 2023. This indicates a growing demand for Bitcoin mining and is attributed to Texas’ pro-crypto policy environment21.
If all mines met their proposed capacity increase (see Supplementary Information), the total capacity would increase from 3910 MW to 7945 MW, representing a 103% increase. To account for this rise in the energy demand, future research should expand the dataset to include more mines and update power capacities in this rapidly evolving industry.
Finally, the increase in toxic PM2.5 air pollution induced by Bitcoin mining will negatively impact human health. PM2.5 increases mortality, morbidity, and hospitalization risk. Air pollution from coal-fired power plants (coal PM2.5) is particularly toxic, with a mortality risk 2.1 times greater than that of PM2.5 from other sources. Thus, a holistic assessment of the impact of Bitcoin mines should consider their health and environmental impact.


