

Bitcoin Price Analysis
Bitcoin’s price continued its recent sequence of alternating between red and green candles for the sixth straight day on Tuesday and concluded its daily session +$123.6.
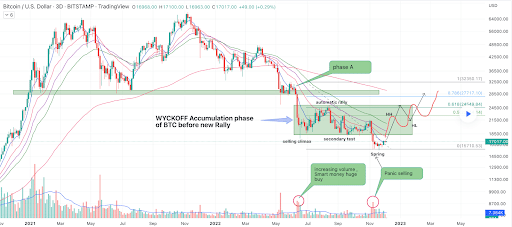
The BTC/USD 3D chart below from ergal91 is the first chart we’re analyzing for this Wednesday.
BTC’s price is trading between the 0 fibonacci level [$15,710.53] and the 0.5 fib level [$22,544.14], at the time of writing.
We can see below that the chartist denotes that Bitcoin’s price is currently in a Wyckoff Accumulation phase before its next rally.
If BTC’s price does rally soon, the targets are as follows: 0.5, 0.618 [$24,549.84], 0.786 [$27,717.1], and the 1 fib level [$32,350.17].
Bearish traders want to send BTC’s price down next to retest Bitcoin’s multi-year low at the 0 fibonacci level.
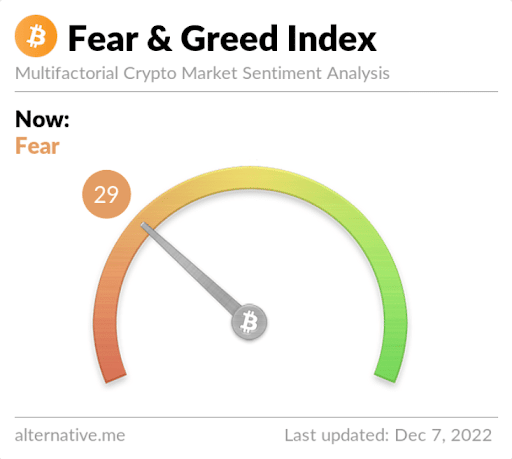
The Fear and Greed Index is 29 Fear and is +4 from Tuesday’s reading of 25 Extreme Fear.
Bitcoin’s Moving Averages: 5-Day [$17,000.74], 20-Day [$16,620.06], 50-Day [$18,518.6], 100-Day [$20,011.61], 200-Day [$26,475.42], Year to Date [$28,989.4].
BTC’s 24 hour price range is $16,906.4-$17,103 and its 7 day price range is $16,446.88-$17,362.29. Bitcoin’s 52 week price range is $15,501-$52,027.
The price of bitcoin on this date last year was $50,634.
The average price of BTC for the last 30 days is $17,124.3 and its -19.7% over the same duration.
Bitcoin’s price [+0.73%] closed its daily candle worth $17,089.8 and back in green figures again on Tuesday.
Ethereum Analysis
Ether’s price followed the aggregate cryptocurrency market higher on Tuesday and when traders concluded the daily session, ETH’s price was +$11.71.
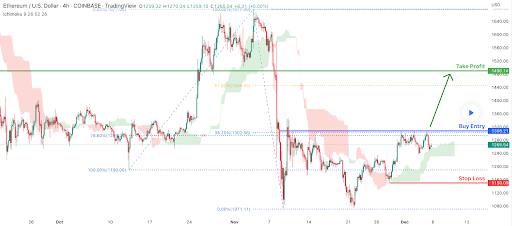
The second chart on Wednesday’s docket is the ETH/USD 4HR chart by desmondlzw. At the time of writing, Ether’s price is trading between the 0.00% fib level [$1,071.11] and 38.20% [$1,302.56].
The targets to the upside on ETH are 38.20% and the 61.80% fib level [$1,445.55]. The chartist’s bias is that ETH’s price action is bullish because its currently trading above the Ichimoku Cloud on the 4HR timescale.
Conversely, the targets to the downside for those still shorting Ether’s market are the 0.00% fib level followed by a trip back to a triple digit ETH price with ETH’s multi-year low of $883.62 as a third target.
Ether’s Moving Averages: 5-Day [$1,275.69], 20-Day [$1,217.40], 50-Day [$1,326.41], 100-Day [$1,468.72], 200-Day [$1,847.19], Year to Date [$2,040.67].
ETH’s 24 hour price range is $1,241.56-$1,274.76 and its 7 day price range is $1,217.41-$1,302.22. Ether’s 52 week price range is $883.62-$4,482.76.
The price of ETH on this date in 2021 was $4,307.11.
The average price of ETH for the last 30 days is $1,258.08 and its -23.96% for the same interval.
Ether’s price [+0.93%] closed its daily session on Tuesday worth $1,271.75.
GALA Analysis
GALA’s price was the top performer of the lot on Tuesday and when traders settled-up for the daily session, GALA’s price was +$0.00121.
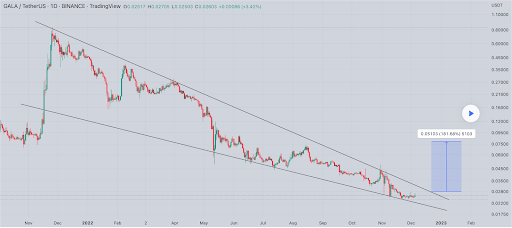
The final chart we’re looking at for this Wednesday is the GALA/USDT 1D chart below from Worldofchartsfx.
GALA’s price is clearly inside a textbook falling wedge on the daily timescale. For bullish traders to break out of this falling wedge these traders need to eclipse the $0.03143 level.
Bearish market participants want to continue the downtrend that we can see began back in November of 2021. For bears to break out to the downside they need to push GALA’s price below the $0.02157 level.
GALA’s 24 hour price range is $0.025-$0.028 and its 7 day price range is $0.024-$0.028. GALA’s 52 week price range is $0.023-$0.625.
GALA’s price on this date last year was $0.477.
The average price of GALA over the last 30 days is $0.027 and its -30.03% over the same interval.
GALA’s price [+4.68%] closed its daily session on Tuesday worth $0.02708 and in positive digits for a third consecutive trading day.

 Trial, and CZ’s Sentencing: This Week’s Crypto Recap")