Using Linux, especially as a server, often means dealing with new errors and resolving them. Most of them are easy to fix with just a web search. But some errors may require that you do some digging. In this guide, I’m sharing some Linux commands that will help you diagnose and solve those kinds of Linux errors.
1 dmesg
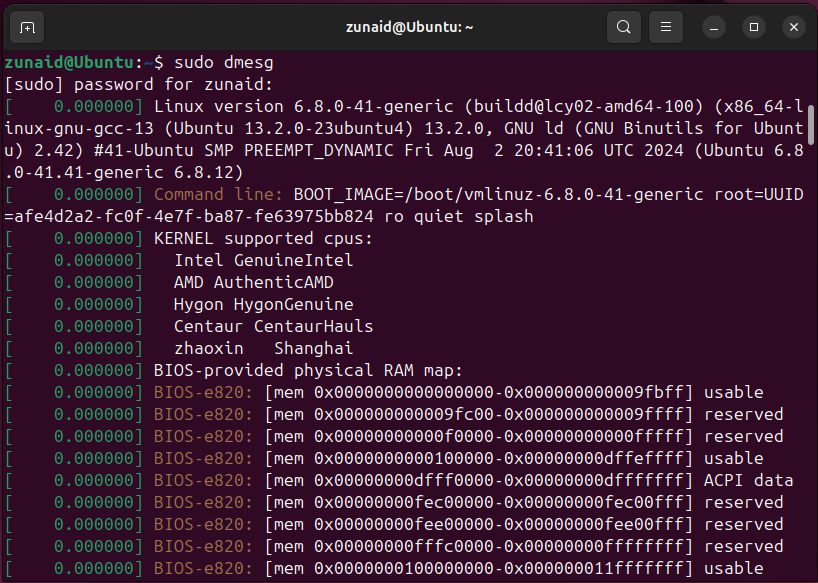
The dmesg command is a powerful tool for printing Linux kernel ring buffer messages. These messages often include system boot messages and hardware errors. Run the command with sudo, like this:
sudo dmesg
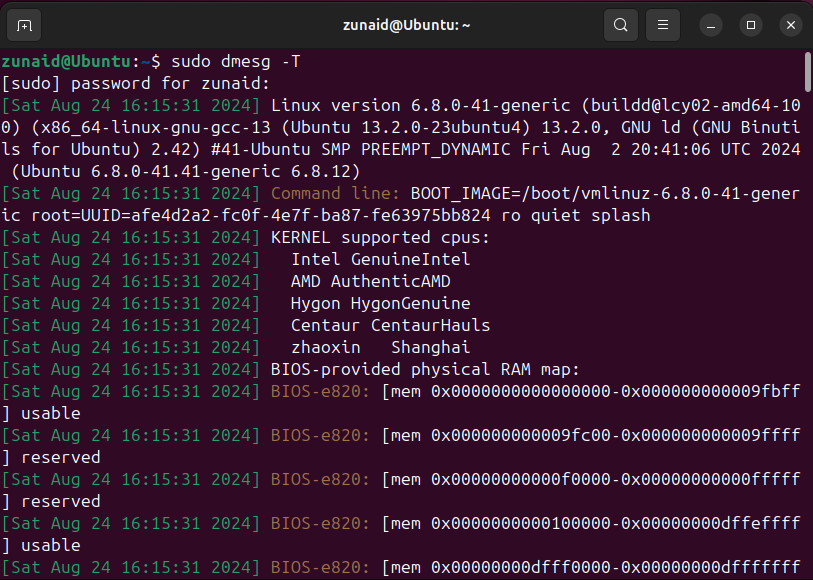
You can also display them with human-readable timestamps.
sudo dmesg -T
The output you get from dmesg can be piped to other commands like grep for further processing.
2 systemctl
The systemctl command is used for managing services on systems using systemd. You can turn on/off a service, check log entries, and list all services with details using the command.
To check the status of a service, run:
systemctl status service_name
If you need to start or stop a service, run:
systemctl start service_namesystemctl stop service_name
If you need to restart a service, run:
systemctl restart service_name
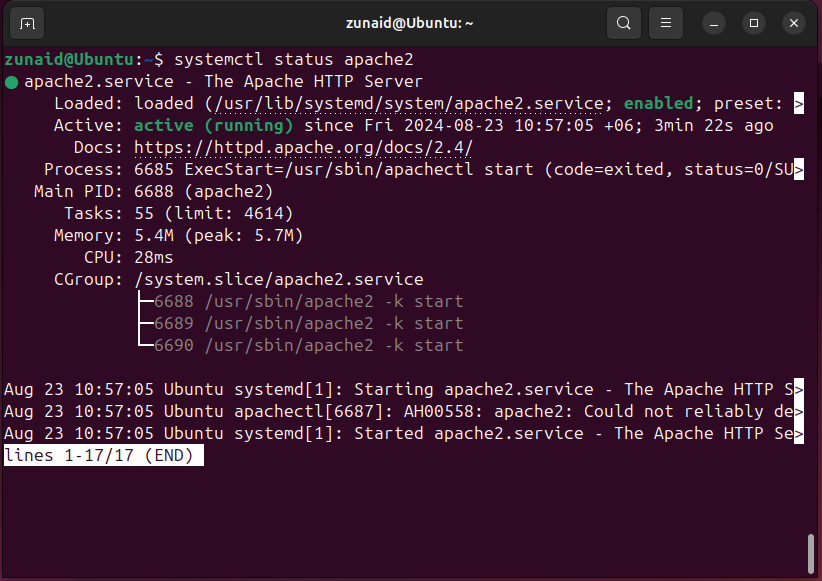
For example, my Apache web server wasn’t responding. I could check if the service is active.
systemctl status apache2
If it’s not running, I can start or restart it.
3 ps
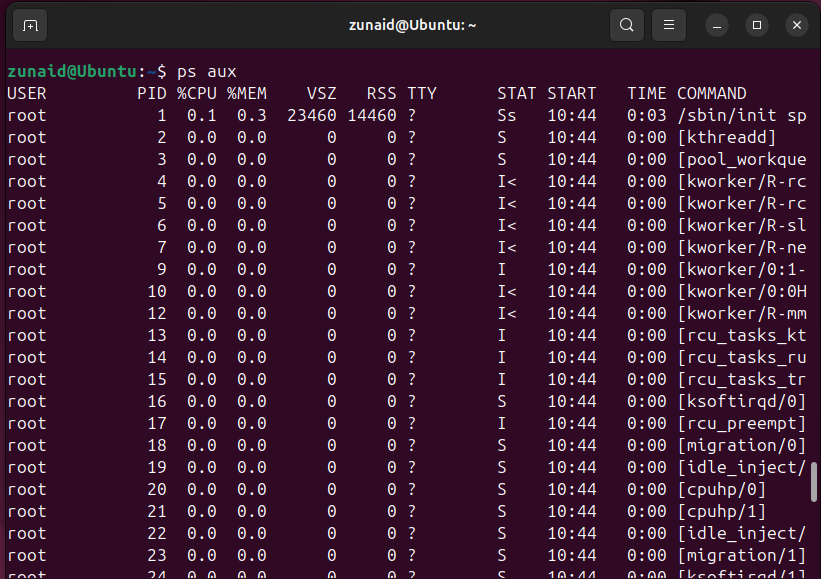
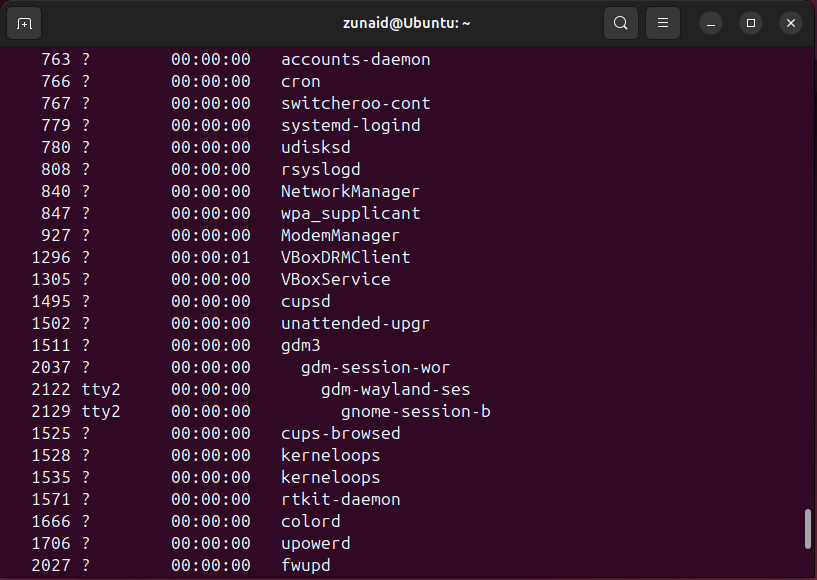
The ps command allows you to display information about and monitor Linux processes. To get a detailed overview of all processes, run:
ps aux
If you want to list the processes in a hierarchical format, then run:
ps -He
You can use the ps command to list processes with resource usage or to know a certain process ID.
4 kill
The kill command is useful for forcefully terminating a running process. Sometimes, multiple processes can conflict with each other. Hence, one process fails to execute. That’s when you can kill the process causing the issue. To kill a process, you must know its process ID (PID.) You can get the PID using the ps command. Kill the process by passing the PID to the kill command,
kill
For example, to kill the Apache process, I’ll run:
kill 7052
You may also need to have sudo to execute the command
5 ping
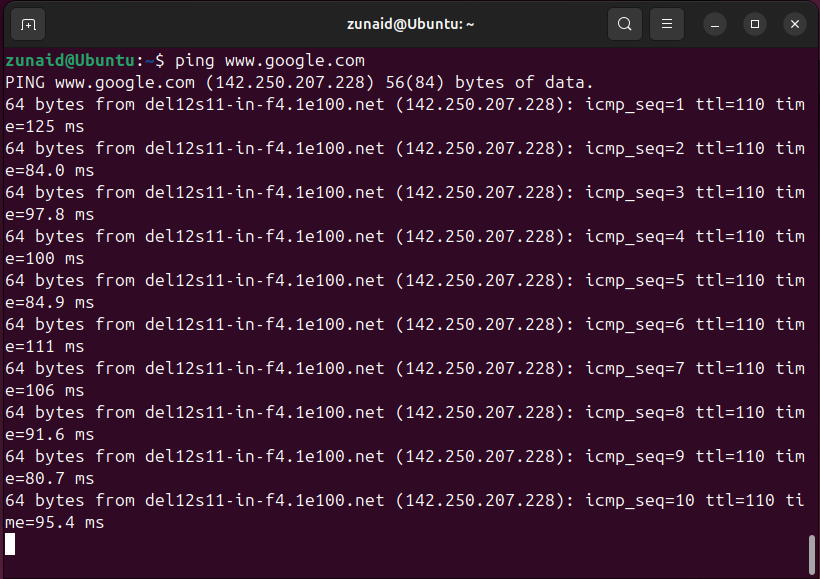
ping is a networking tool for checking the availability of a host on a network. It can help you determine if your network connection is live and if the DNS is resolving correctly.
You can use the ping command by passing a hostname, preferably the URL or the IP address, like this:
ping www.google.com
The packet loss info also lets you know your network performance. You can also use ping on Windows.
6 lsof
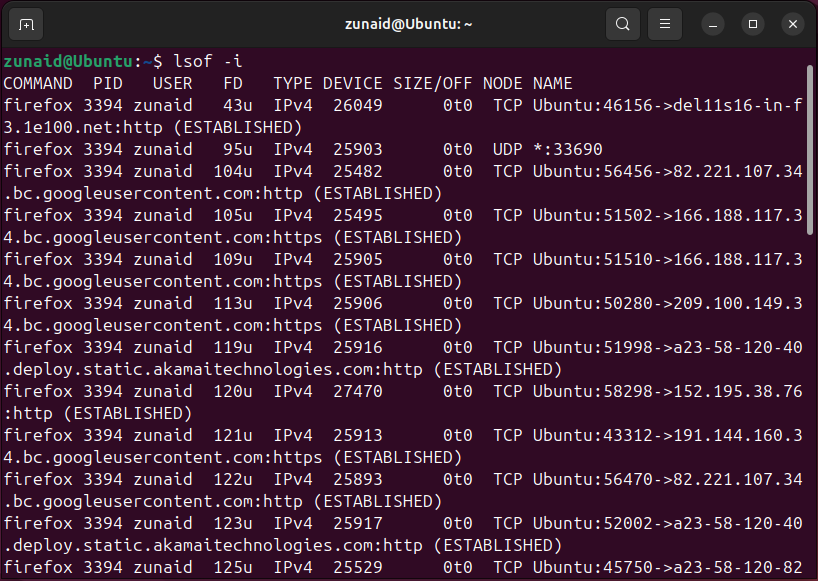
The lsof command is used to list open files. It can be used on many occasions, such as network debugging, and listing files by processes, users, and ports.
If you want to see files opened related to the network, run:
lsof -i
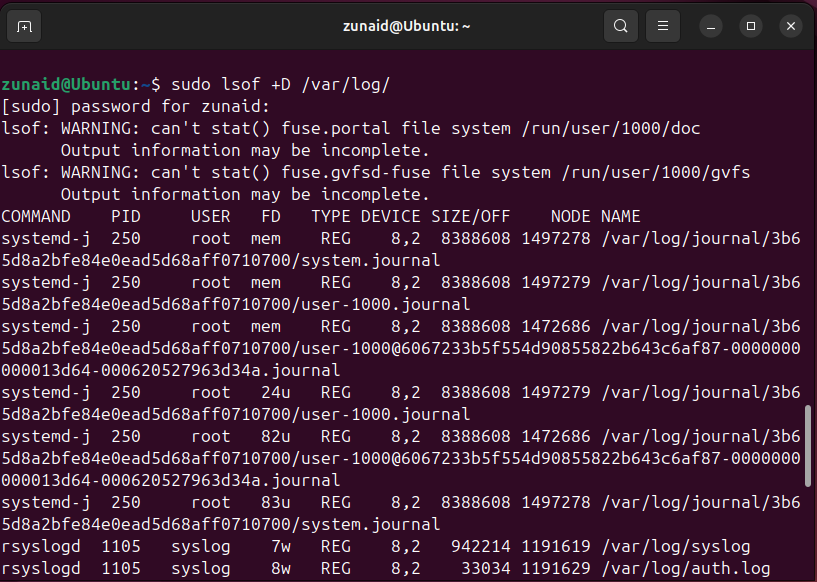
If you want to see the files opened in a specific directory, then use:
lsof +D /path/to/directory
The lsof command can help you find which processes are using which files so you can address them properly.
7 grep
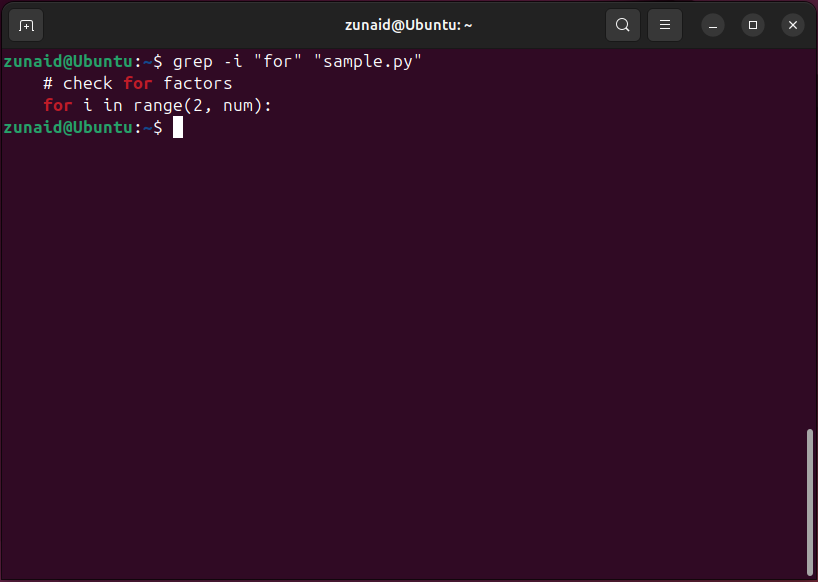
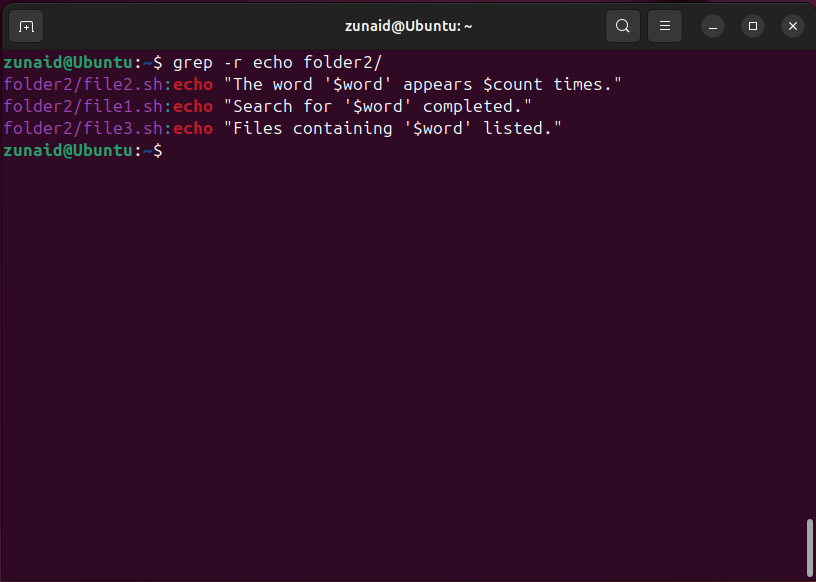
The grep command is useful for searching for strings and patterns through files and whole directories. To do a simple search, you pass the pattern and the file name or directory to the grep command.
grep -i pattern file_name
grep -r pattern dir_name
Suppose you have log files with thousands of entries. The grep command will help you search for lines relevant to your problems. You may also search for common words such as “error” or “failed” to find the lines quickly. You can also pipe the output of another command to grep.
8 tail
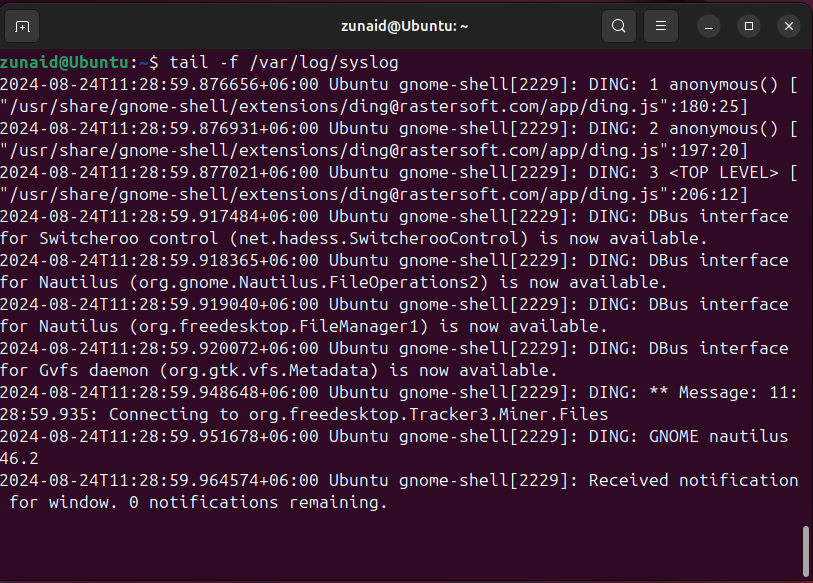
The tail command is usually used to display the last few lines of a file. If you have log files that are too long and you’re only interested in the latest additions to the file, tail becomes handy. You can also use tail to actively monitor a log file, with this command:
tail -f file_name
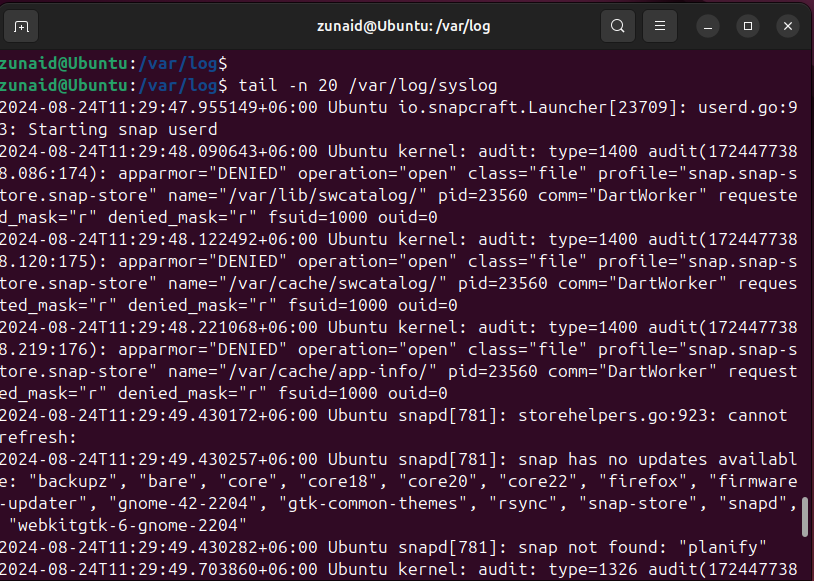
Another useful feature of the command is displaying a certain number of lines. Suppose you want to display the last 20 lines from a file. Then run:
tail -n 20 file_name
The tail command can also be used to pipe the output of another command.
9 journalctl
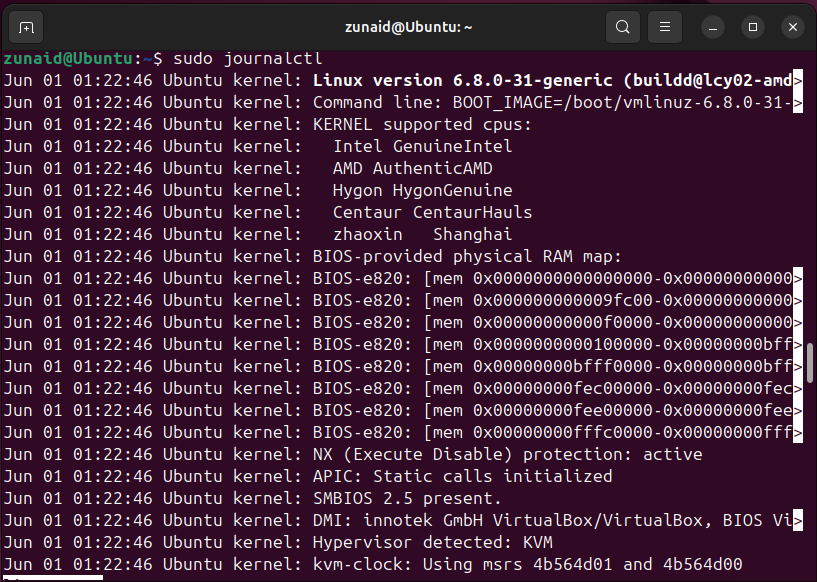
The journalctl command is useful for querying and displaying logs from systemd’s journal. You can simply run the command without any parameters (adding sudo is better for getting more details.)
sudo journalctl
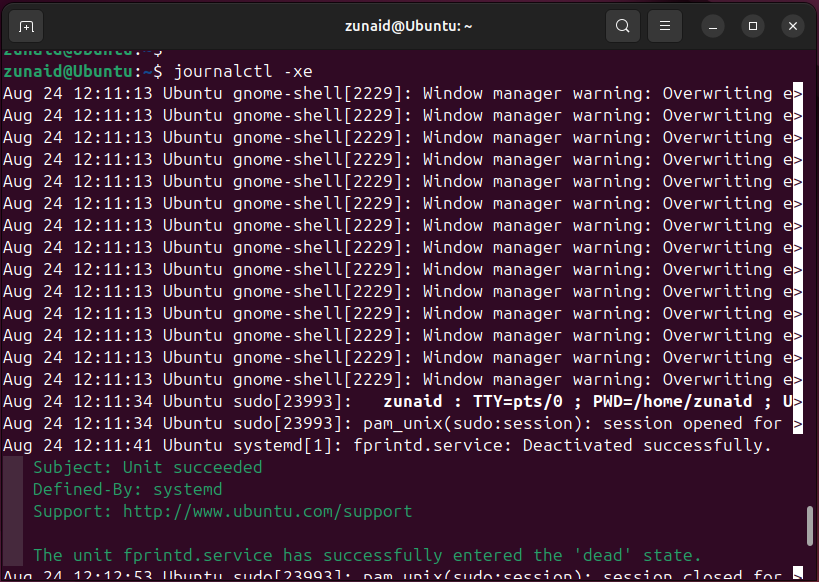
You can also display the most recent logs with extra information.
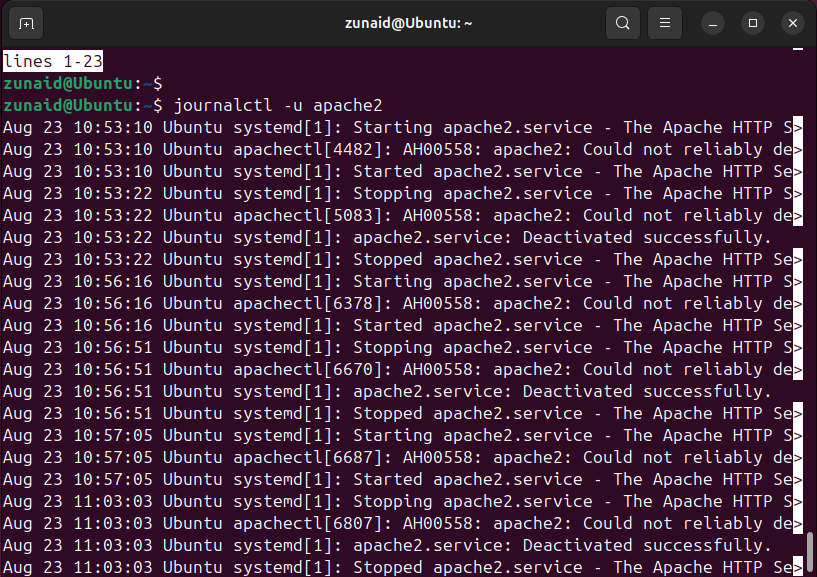
If you want to check the logs of each service, run:
journalctl -u service_name
Suppose you had a system crash. The journalctl command will help you investigate and identify the root cause.
10 strace
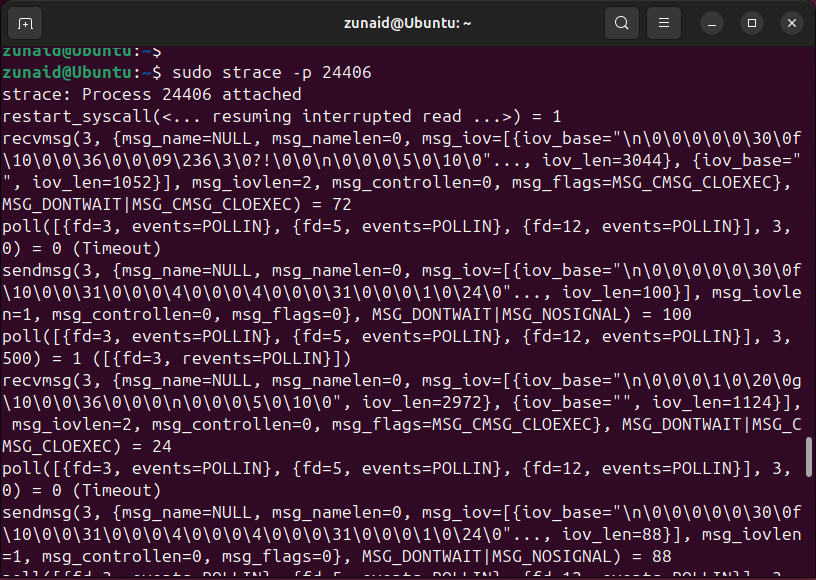
The strace command traces system calls and signals. It provides a detailed look at what a process is doing. A simple use of strace is to trace a running process using its PID.
strace -p PID
You can also the above output by system calls.
strace -p PID -e system_call,system_call2
It also lets you save the trace output to a file.
strace -o output.txt command_name
If a program happens to be hanging, and you can’t find the reason, you can trace the system calls the program is making and reveal why it’s getting stuck.
11 htop
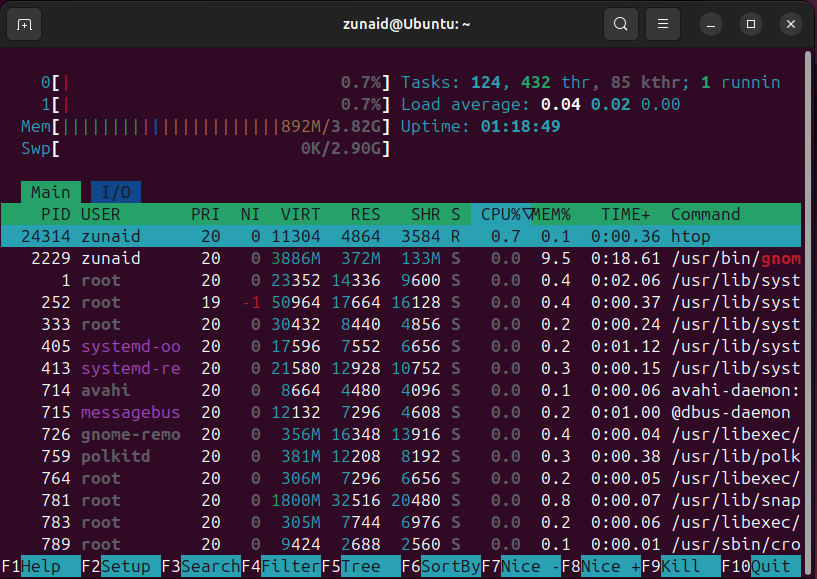
The htop command line tool acts like an interactive process viewer, providing a real-time and dynamic overview of system processes. You need to first install it and then run:
htop
It has many options indicated at the bottom. Pressing F6 lets you sort processes by different metrics like CPU or memory usage. If your system is under heavy load, htop helps you quickly recognize resource hogs through an intuitive interface.
12 df
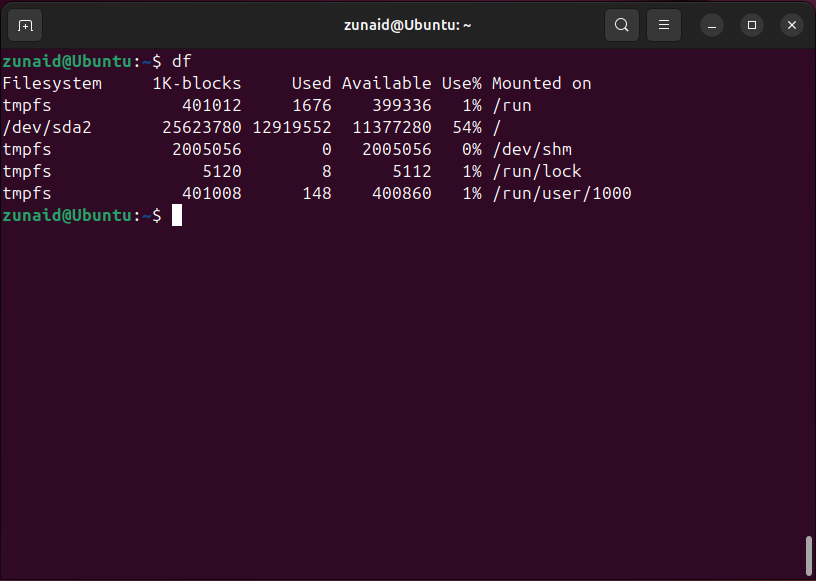
The df command is used for analyzing disk space usage. It gives you an overview of your total and available disk space. You can run the command as is.
df
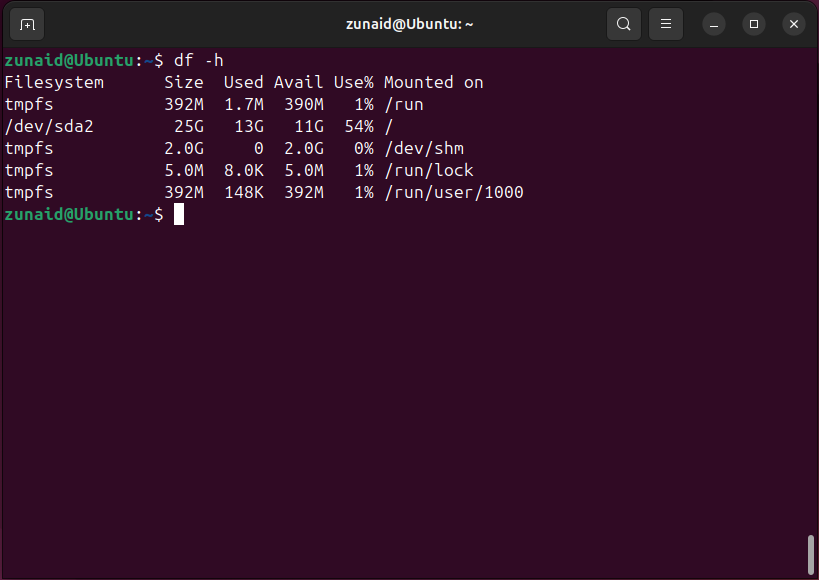
But the better way to run the command is to use the -h flag, which displays the disk usage in a more human-readable format.
df -h
If you’re running out of space on the system, you can use the df command to analyze which files are taking up the most space and free space accordingly.
13 free
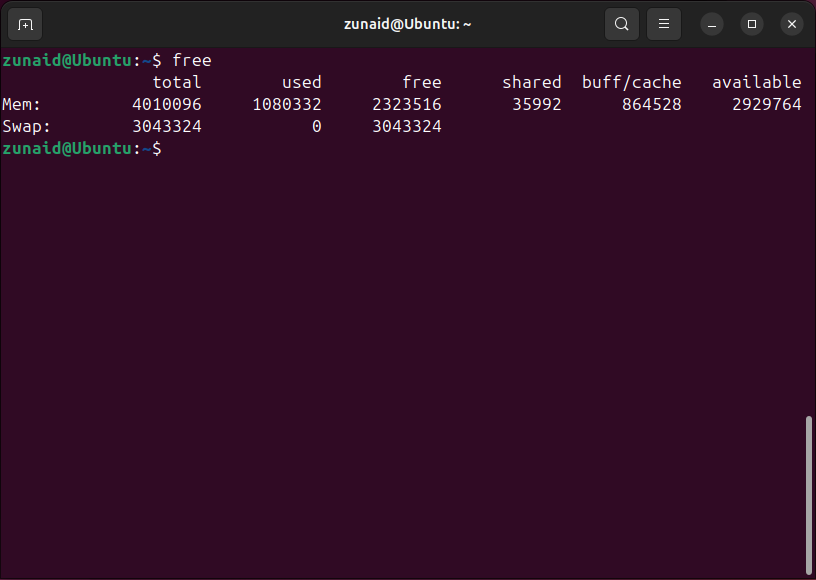
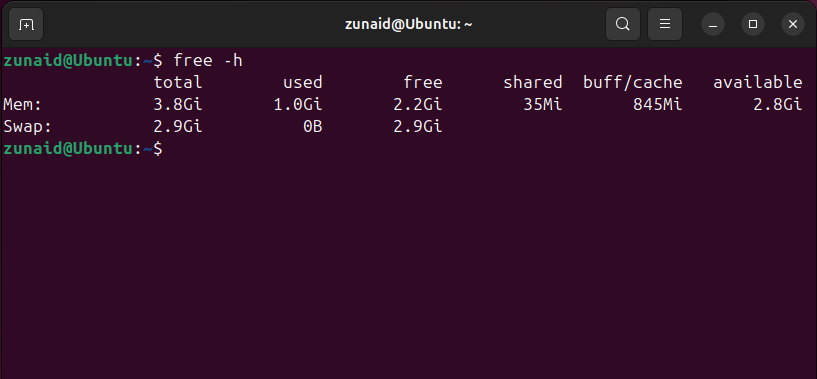
The free command is used to check your system’s RAM usage. This also includes the swap memory. Simply run the command like this:
free
Like df, the free command has the option to display information in a human-readable format.
free -h
The free command will help you if you’re running out of memory and let you know if swapping is occurring.
14 lscpu
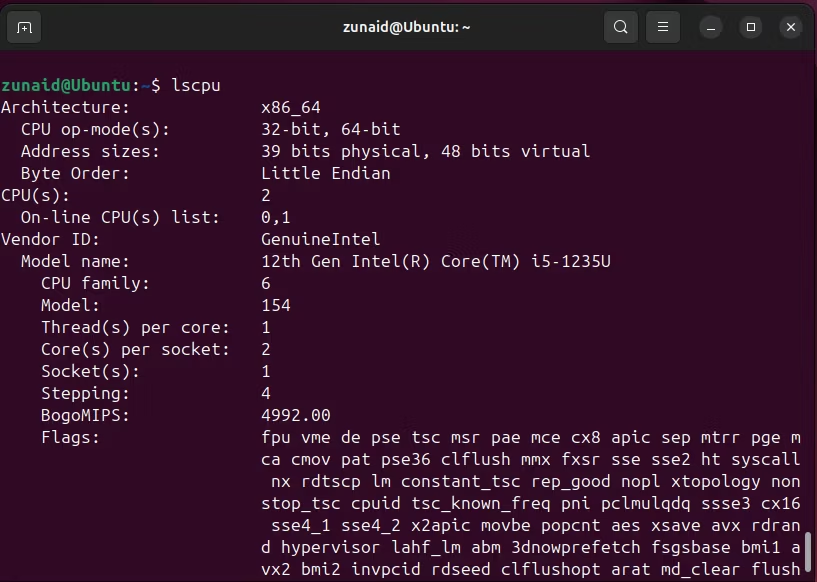
The lscpu command displays information about your system architecture. Once I tried to install a piece of software but failed, only to discover that I was trying to install software made for ARM CPU, while my system was x86_64. To display CPU information, run:
lscpu
You can also get other information such as your CPU capabilities, virtualization features, and vulnerabilities.
Learning these important Linux commands has not only helped me become a better troubleshooter, but also deepened my understanding of Linux system operations. These commands are diverse in nature, so no matter what kind of problem you might be facing, these will come in handy.


