BTC price opened trading on March 25 above the $67,500 territory, as the bulls staged an 8% weekend recovery from Bitcoin ETFs’ $840 million sell-off last week.
Bitcoin price battled bearish headwinds last week as ETFs piled on selling pressure. On-chain data trends suggest BTC is poised for more volatility in the week ahead.
Why is Bitcoin price up today?
Bitcoin price surged as high as $67,600 in the early hours of March 25, largely thanks to rapid after-market purchases from US-based whale investors over the weekend.
Bitcoin ETFs recorded the largest weekly negative netflows since inception, with BTC outflows topping $800 million. This sent Bitcoin prices spiraling toward $65,000 at close of trading of March 22.
However, on-chain data shows how strategic whale investors took advantage of the price dip to acquire more BTC over the weekend, triggering an 8.3% price bounce in the process.
Cryptoquant’s Coinbase Premium Index chart provides a real-time differences between BTC prices quoted on Coinbase Pro, in comparison to Binance exchange’s.

The Coinbase Premim Index swung upwards as BTC price dipped below $65,000 on March 22, and stayed in positive values over the weekend.
Coinbase Pro’s clientele is largely dominated by US-based corporate entities looking to trade in a more regulated environment, while Binance dominates global retail trading.
In essence, positive values of the Coinbase premium index indicates peak buying activity among US-based whale investors creating a slightly higher pricing on Coinbase than Binance.
While the whales buying pressure appears to have driven up BTC price 8% over the weekend, other vital market metrics suggest that more volatility could follow as the coming week unfolds.
Volatility ahead: Long-term investors spotted moving BTC worth $6.4 billion
The 4th Bitcoin halving event scheduled for April 20 is now less than a month away. Strategic investors are making calculated moves to profit off the potential price impact of the BTC halving.
An unusual trend emerged at the weekend, signaling that some long-term investors could be on the verge of executing a major sell-off.
The Santiment chart below shows the number of recently-traded coins that had been previously held unmoved for 365 days or more. This serves as a proxy for tracking impending sell-offs among long-term investors.

On March 23, long-term investors moved 97,737 BTC coins that were previously held dormant for over one year. Valued at the the current price of $67,500, the long-term investors have shifted BTC worth over $6.4 billion in to circulation.
When long-held coins begin to move as ahead of major network event, such as the forthcoming Bitcoin halving, it is a firm indication of an imminent sell-off.
There’s a possibility that the long-term holders have shifted the coins into a different storage option. However, considering that BTC prices have jumped by over 120% since March 2023, the holders are highly incentivized to sell.
Hence, if that fresh supply of $6.4 billion worth BTC start trickling into the market supply, it could trigger intense market volatility in the week ahead.
Bitcoin price forecast: Pre-halving profit-taking could scuttle $75,000 rally
Drawing insights from the $6.4 billion surge in dormant BTC supply in circulation, Bitcoin price is likely to face intense sell-pressure in the week ahead, potentially scuttling chances of new all-time highs above $75,000.
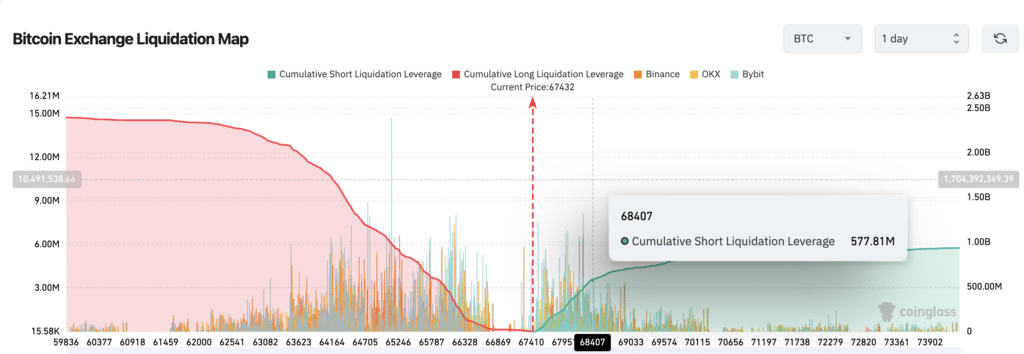
Although, bulls currently appear in control having staged an 8% weekend rebound, the placement of leveraged short positions in the derivatives markets shows that breaking above $70,000 could be a tall-order.

As seen above, the majority of high-leverage short positions are mounted around the $68,400 territory. Seeing that this is a high-volume trade territory, strategic traders could look to execute large profit-taking sell-orders with minimal slippage, while short-traders looking to mitigate losses could also simultaneously deploy stop-loss orders.
Both of these factors could combine to exert intense downward pressure on Bitcoin price in the coming days.
But on the flip side, if the market takes a positive turn and BTC breaks above the $70,000, the bulls face minimal resistance on the road to $75,000.


