

- Bitcoin price breaks above the consolidation zone between $57,000 and $62,000, with an impending rally ahead.
- Ethereum price approaches the $2,900 resistance barrier; breaking above signals a bullish move ahead.
- Ripple price achieving a breakout above the $0.626 resistance level could suggest a positive trend.
Bitcoin (BTC) price broke out of the consolidation zone between $57,000 and $62,000, showing that a rally is imminent. Ethereum (ETH) is moving close to the $2,900 resistance level, which, if crossed, indicates a bullish move. Ripple (XRP) breakthrough over the $0.626 barrier level may portend an uptrend.
Bitcoin price shows potential for a rally as it breaks above key resistance
Bitcoin price broke above its resistance level, the 200-day Exponential Moving Average (EMA) at $62,280 and its 61.8% Fibonacci retracement level (drawn from the high on July 29 to the low on August 5) at $62,042 on Friday. At the time of writing on Monday, it is slightly down 0.2% at $64,144.
If the 200-day EMA at $62,280 holds as support and BTC closes above the $65,596 level, it could rally 7% to restest its July 29 high of $70,079.
This bounce is supported by indicators like the Relative Strength Index (RSI) and Awesome Oscillator (AO) on the daily chart, comfortably above their respective mean levels of 50 and zero. These momentum indicators strongly indicate bullish dominance.
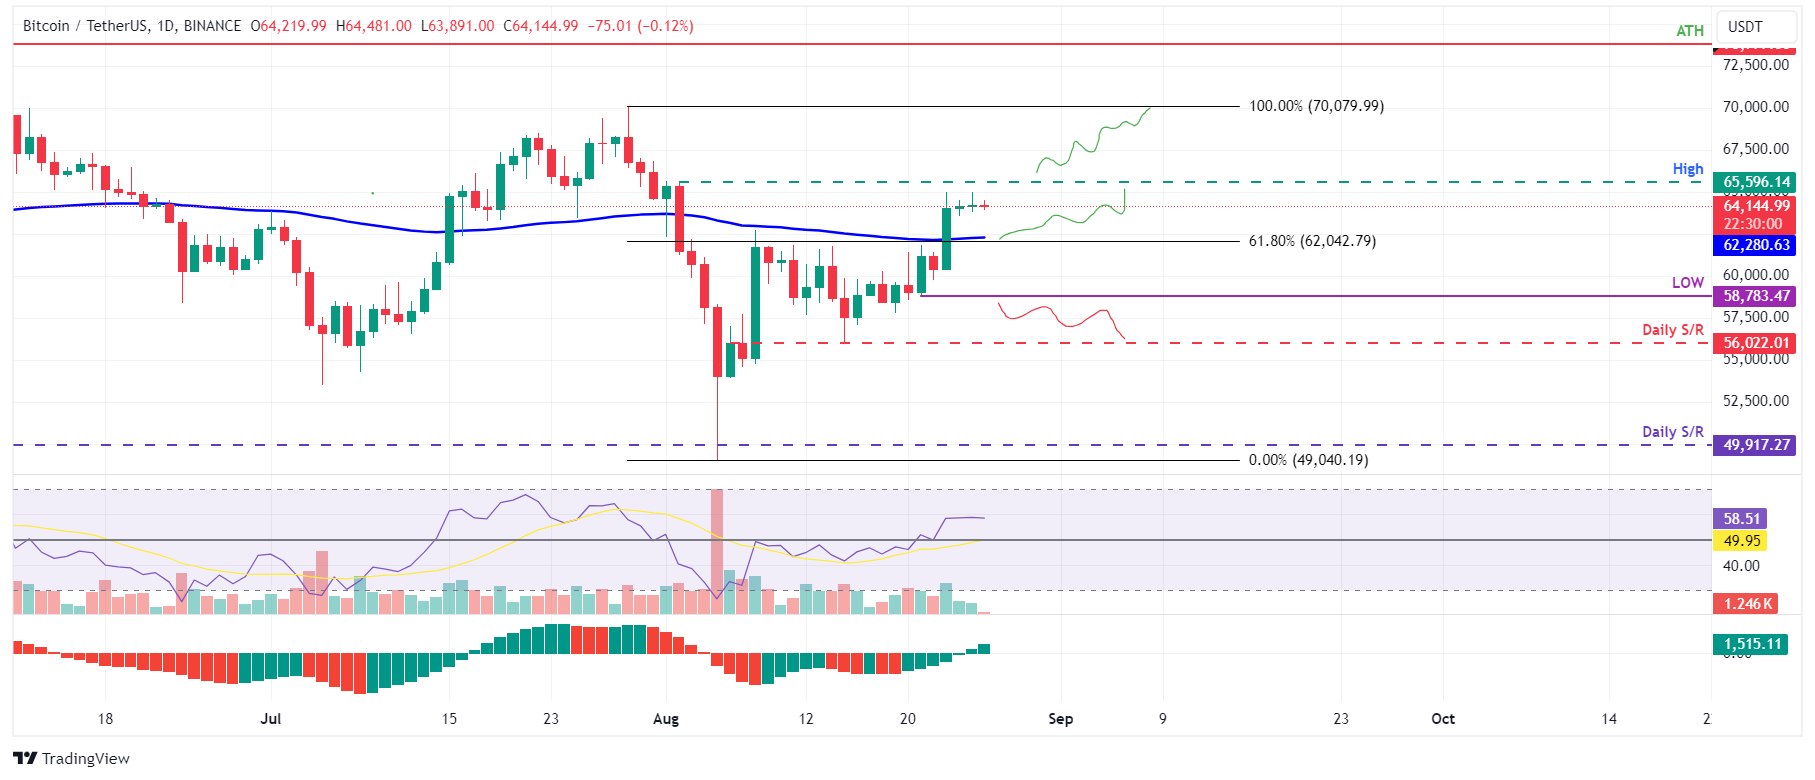
BTC/USDT daily chart
However, if Bitcoin’s price closes below the August 21 low of $58,783, a 5% decline towards daily support at $56,022 would be on the cards, as it would set a lower high on the daily chart. Thus invalidating the bullish thesis.
Ethereum price is set for a rally after breaking above its $2,900 resistance barrier
Ethereum price finds resistance around the 50% price retracement level at $2,843, which roughly coincides with the daily resitance level at $2,927 and the 50-day EMA at $2,905.As of Monday, trades are slightly lower, by 0.2%, at $2,737.
If ETH breaks above the $2,843 level and closes above the daily resistance at $2,927, it could rally 11% to retest its weekly resistance level at $3,236.
The daily chart RSI and AO are trading closely below their neutral levels of 50 and zero. Both indicators must trade above their neutral levels for the bullish momentum to be sustained.
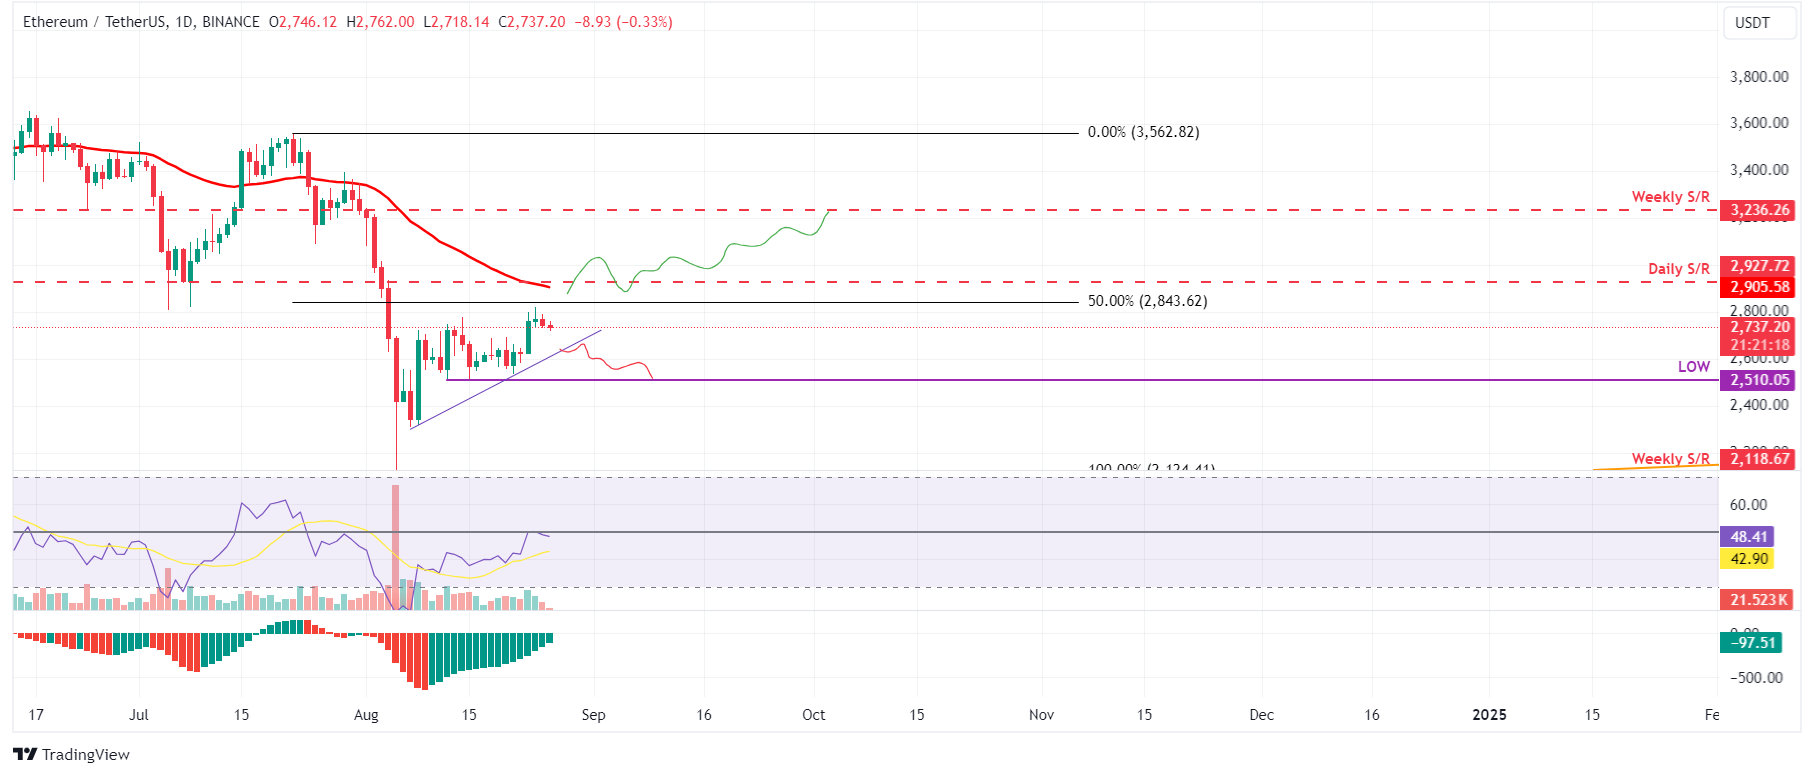
ETH/USDT daily chart
On the other hand, if ETH breaks below the ascending trendline, it would invalidate the bullish thesis. This event would lead to a 4.6% decline in Ethereum’s price, which would revisit its August 12 low of $2,510.
Ripple price is poised for a rally after breaking above its daily resistance at $0.626
Ripple price retested and was rejected by its daily resistance level at $0.626 on Saturday. It declined 2% on Sunday. On Monday, it continuously retraced down by 0.5% to $0.596.
If the Ripple price continues to retrace, it could find support around its daily support at $0.544. This support zone roughly coincides with the 200-day EMA at $0.551, making it a key support zone.
If the $0.544 level holds as support, it may rise to $0.626 before rallying by 5% to test its July 31 high of $0.658.
The RSI and AO indicators on the daily chart trade above their neutral levels of 50 and zero, respectively. These momentum indicators strongly indicate bullish dominance.
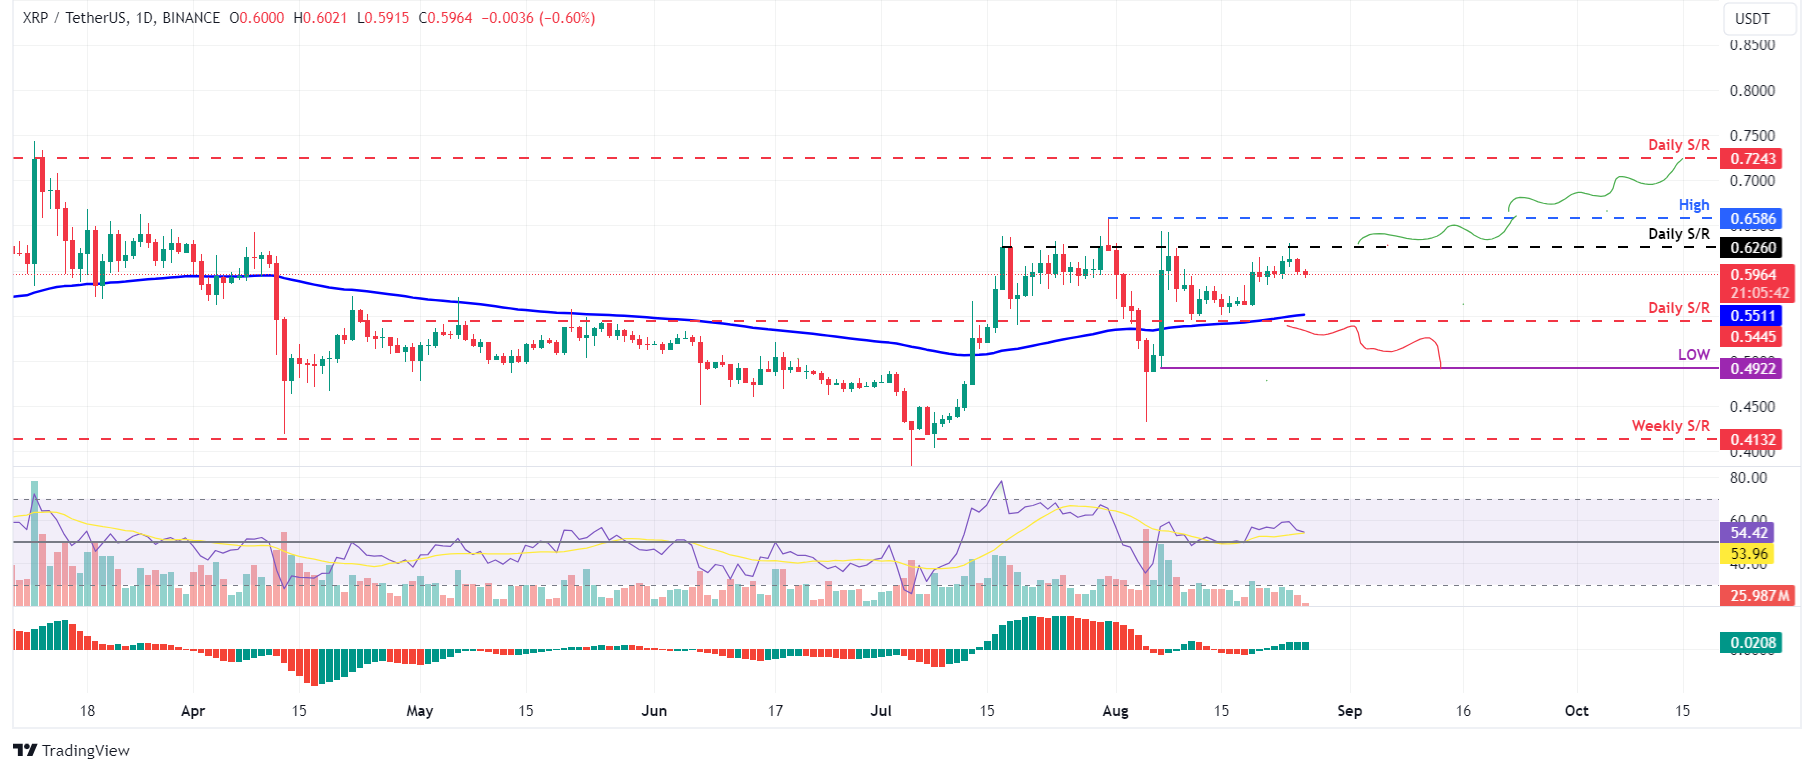
XRP/USDT daily chart
However, if Ripple price closes below the $0.544 daily support level, it would shift the market structure by creating a lower low on the daily chart, potentially leading to a 9.5% decline to revisit the August 7 low of $0.492.


