

- Bitcoin price approaches the $58,700 level; a close below could continue its downward move.
- Ethereum price breaks below the ascending trendline, signaling a bearish trend ahead.
- Ripple price retests its 200-day EMA at $0.551; a slip below would suggest a bearish move on the horizon.
Bitcoin (BTC) and Ripple (XRP) prices approach their key support level; closing below may signal a continuation of its downward trend. Ethereum (ETH) price has breached its ascending trendline, indicating a potential bearish shift.
Bitcoin price is poised for a downleg following a close below the $58,700 level
Bitcoin price was rejected around the daily resistance level at $65,379 on Sunday, declining by 7.5% in the next two days. On Wednesday, it continues to trade down slightly by 0.1% at $59,368.
If BTC continues to decline and closes below the $58,783 level, it could decline further by 4.5% to retest its daily support at $56,002.
The Relative Strength Index (RSI) on the daily chart has slipped below its neutral level of 50, and the Awesome Oscillator (AO) is on its way to close below its neutral level of zero. If both indicators must trade below their neutral levels, it suggests a weak momentum and an impending bearish trend.
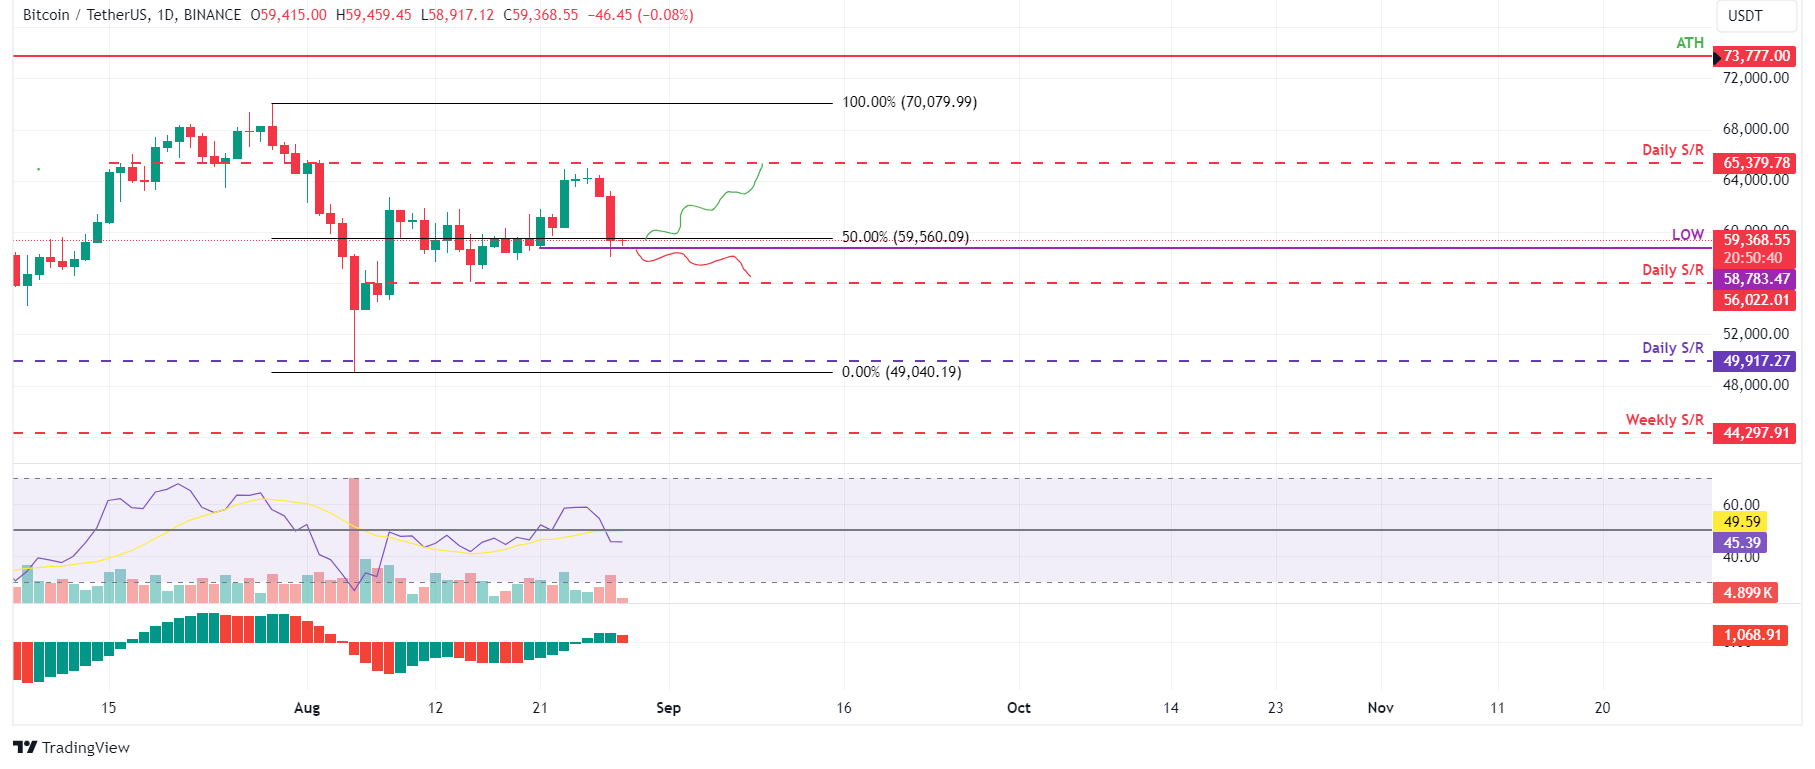
BTC/USDT daily chart
However, if Bitcoin’s price finds support around $58,783 and closes above it, the bearish thesis will be invalidated, and BTC could rally 11% to revisit its daily resistance level at $65,379.
Ethereum price faces a decline after trendline break
Ethereum price finds resistance around the 50% price retracement level at $2,843, which roughly coincides with the daily resistance level at $2,927 and the 50-day Exponential Moving Average (EMA) at $2,869 on Saturday. It declined 11% in the next three days. At the time of writing on Wednesday, it trades slightly up by 0.6% at $2,469.
If ETH pulls back and retests its broken ascending trendline at $2,619, it could continue declining 6% to retest its August 8 low of $2,327.
On the daily chart, the RSI and AO trade below their neutral levels of 50 and zero, respectively, suggesting an impending bearish trend.
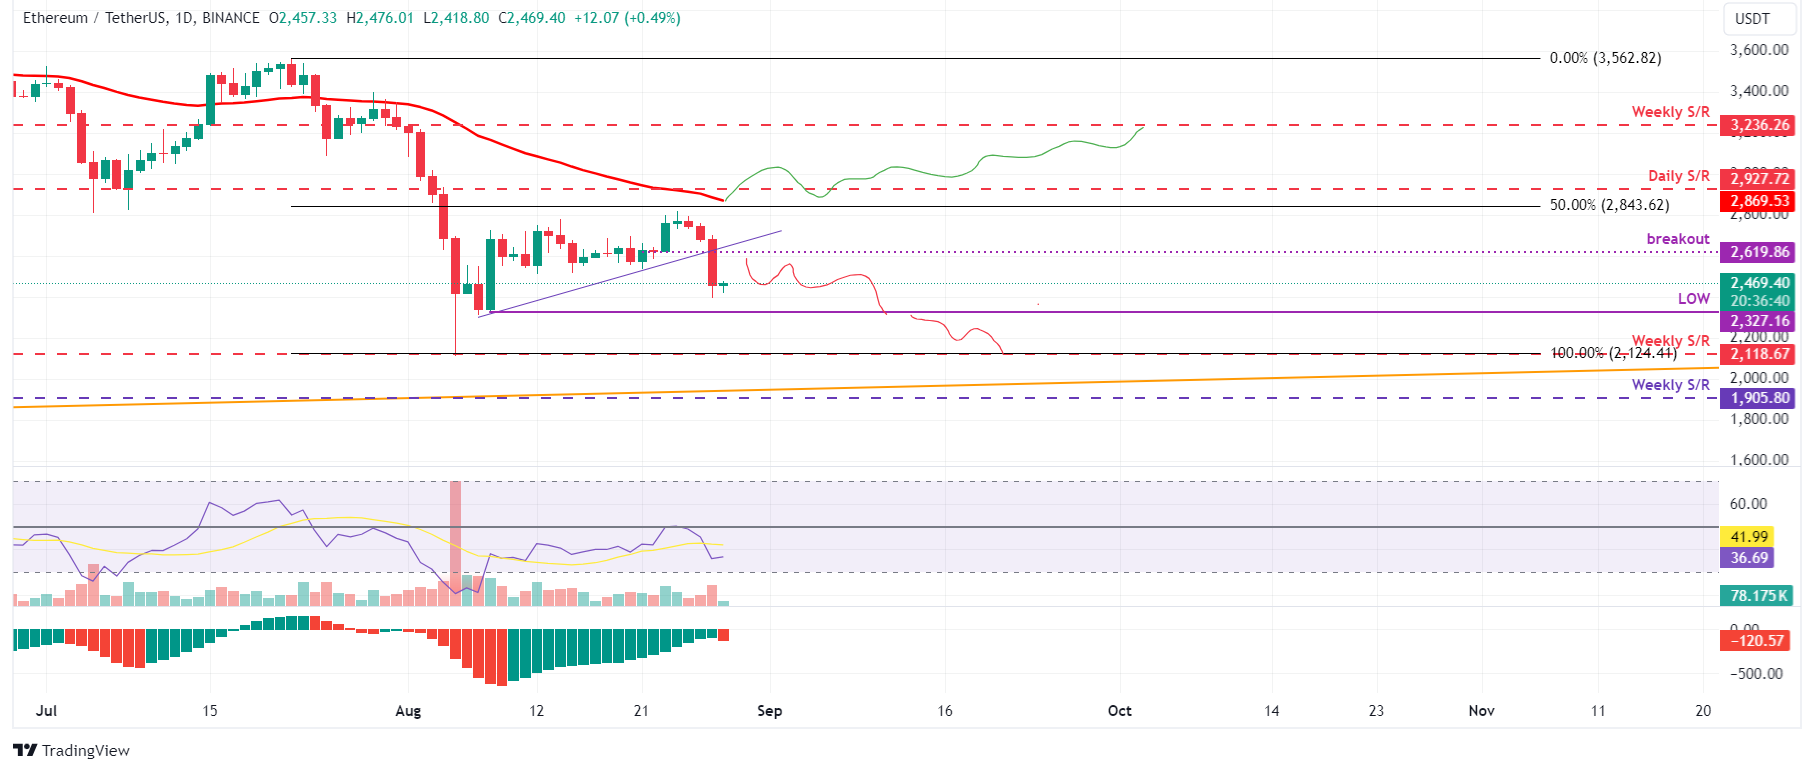
ETH/USDT daily chart
On the other hand, if ETH breaks above the $2,843 level and closes above the daily resistance at $2,927, forming a higher high on the daily chart. This would invalidate the bearish thesis, and it could rally 11% to retest its weekly resistance level at $3,236.
Ripple price set for a decline if it closes below 200-day EMA
Ripple price retested and was rejected by its daily resistance level at $0.626 on Saturday. It declined 7.75% in the next three days and revisited its 200-day EMA at $0.551. On Wednesday, it trades slightly up by 0.2% to $0.567.
If the Ripple price continues to decline and closes below the 200-day EMA at $0.551, it could crash 10% from its current trading level at $0.567 to retest its August 7 low of $0.492.
The RSI on the daily chart has slipped below its neutral level of 50, and the AO is on its way to close below its neutral level of zero. For the bearish momentum to be sustained, both indicators must trade below their neutral levels for the ongoing bearish trend.
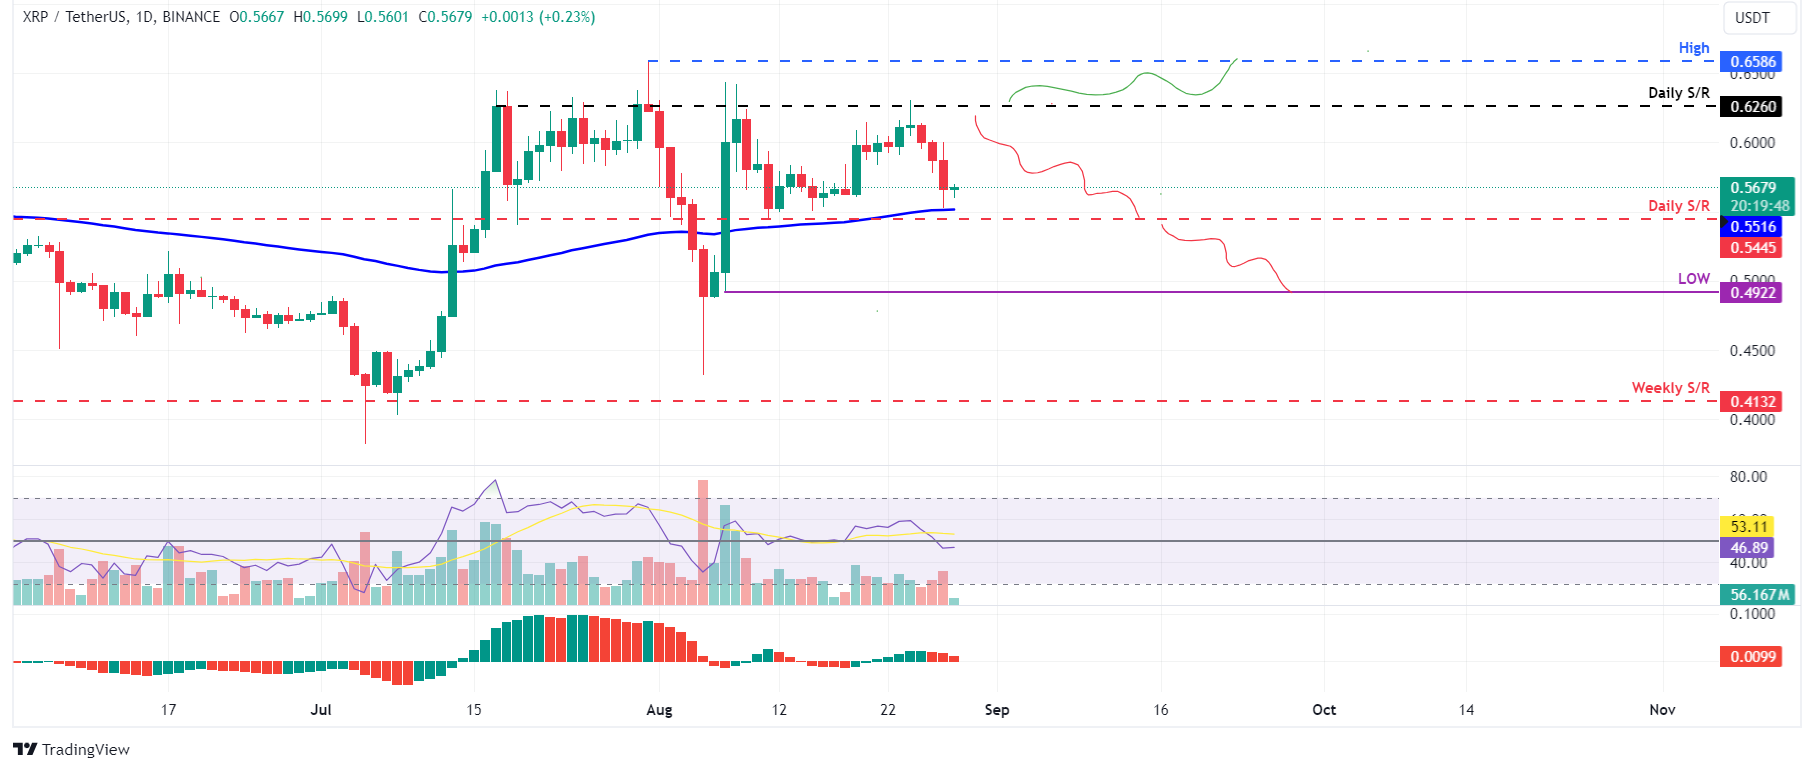
XRP/USDT daily chart
However, if the Ripple price closes above the $0.626 daily resistance level, it would shift the market structure by creating a higher high on the daily chart, potentially leading to a 5.3% rise to revisit the July 31 high of $0.658.


