

Bitcoin (BTC) price remains bearish after the recent crash. The gloom has spread to the rest of the altcoins, with Ethereum (ETH) and Ripple (XRP) price still showing the possibility of a continued slump.
Cryptocurrency metrics FAQs
The developer or creator of each cryptocurrency decides on the total number of tokens that can be minted or issued. Only a certain number of these assets can be minted by mining, staking or other mechanisms. This is defined by the algorithm of the underlying blockchain technology. Since its inception, a total of 19,445,656 BTCs have been mined, which is the circulating supply of Bitcoin. On the other hand, circulating supply can also be decreased via actions such as burning tokens, or mistakenly sending assets to addresses of other incompatible blockchains.
Market capitalization is the result of multiplying the circulating supply of a certain asset by the asset’s current market value. For Bitcoin, the market capitalization at the beginning of August 2023 is above $570 billion, which is the result of the more than 19 million BTC in circulation multiplied by the Bitcoin price around $29,600.
Trading volume refers to the total number of tokens for a specific asset that has been transacted or exchanged between buyers and sellers within set trading hours, for example, 24 hours. It is used to gauge market sentiment, this metric combines all volumes on centralized exchanges and decentralized exchanges. Increasing trading volume often denotes the demand for a certain asset as more people are buying and selling the cryptocurrency.
Funding rates are a concept designed to encourage traders to take positions and ensure perpetual contract prices match spot markets. It defines a mechanism by exchanges to ensure that future prices and index prices periodic payments regularly converge. When the funding rate is positive, the price of the perpetual contract is higher than the mark price. This means traders who are bullish and have opened long positions pay traders who are in short positions. On the other hand, a negative funding rate means perpetual prices are below the mark price, and hence traders with short positions pay traders who have opened long positions.
Bitcoin price could slump further unless conditions change
Bitcoin (BTC) price signals the continuation of a downward trend as prices shifted onto a bearish trajectory after breaking below the ascending trendline. Since the start of the year, price movements have adhered to an ascending channel following a substantial consolidation period. However, by market capitalization, the leading cryptocurrency underwent another consolidation phase in late July.
Notably, last week, Bitcoin price breached this consolidation, descending beneath the lower boundary of the ascending channel, thereby instigating a bearish sentiment.
The pivotal support level of $26,012 holds significance, having previously functioned as a robust resistance threshold. A breach and subsequent close beneath this level would contribute to the existing downward trend, potentially propelling prices toward the critical psychological milestone of $20,000. This equates to a decline of approximately 23% from the current price level.
In conjunction, the Awesome Oscillator (AO) histograms provide clear support for the downward trajectory, evidenced by the prevalence of red and elongated bodies. Similarly, the Williams Percentage R Indicator operates within the oversold range of -80, indicating persistent short-position opportunities.
However, the Exponential Moving Averages (EMA) positioning introduces an exciting facet. With the 50-period EMA situated above the 100-period EMA, there are indications of potential positive movements. This implies the possibility for a minor price retracement before an eventual breach of the critical $26,000 support.
The more prudent approach, therefore, would involve awaiting price confirmation below the $26,000 level before considering entry into a short position.
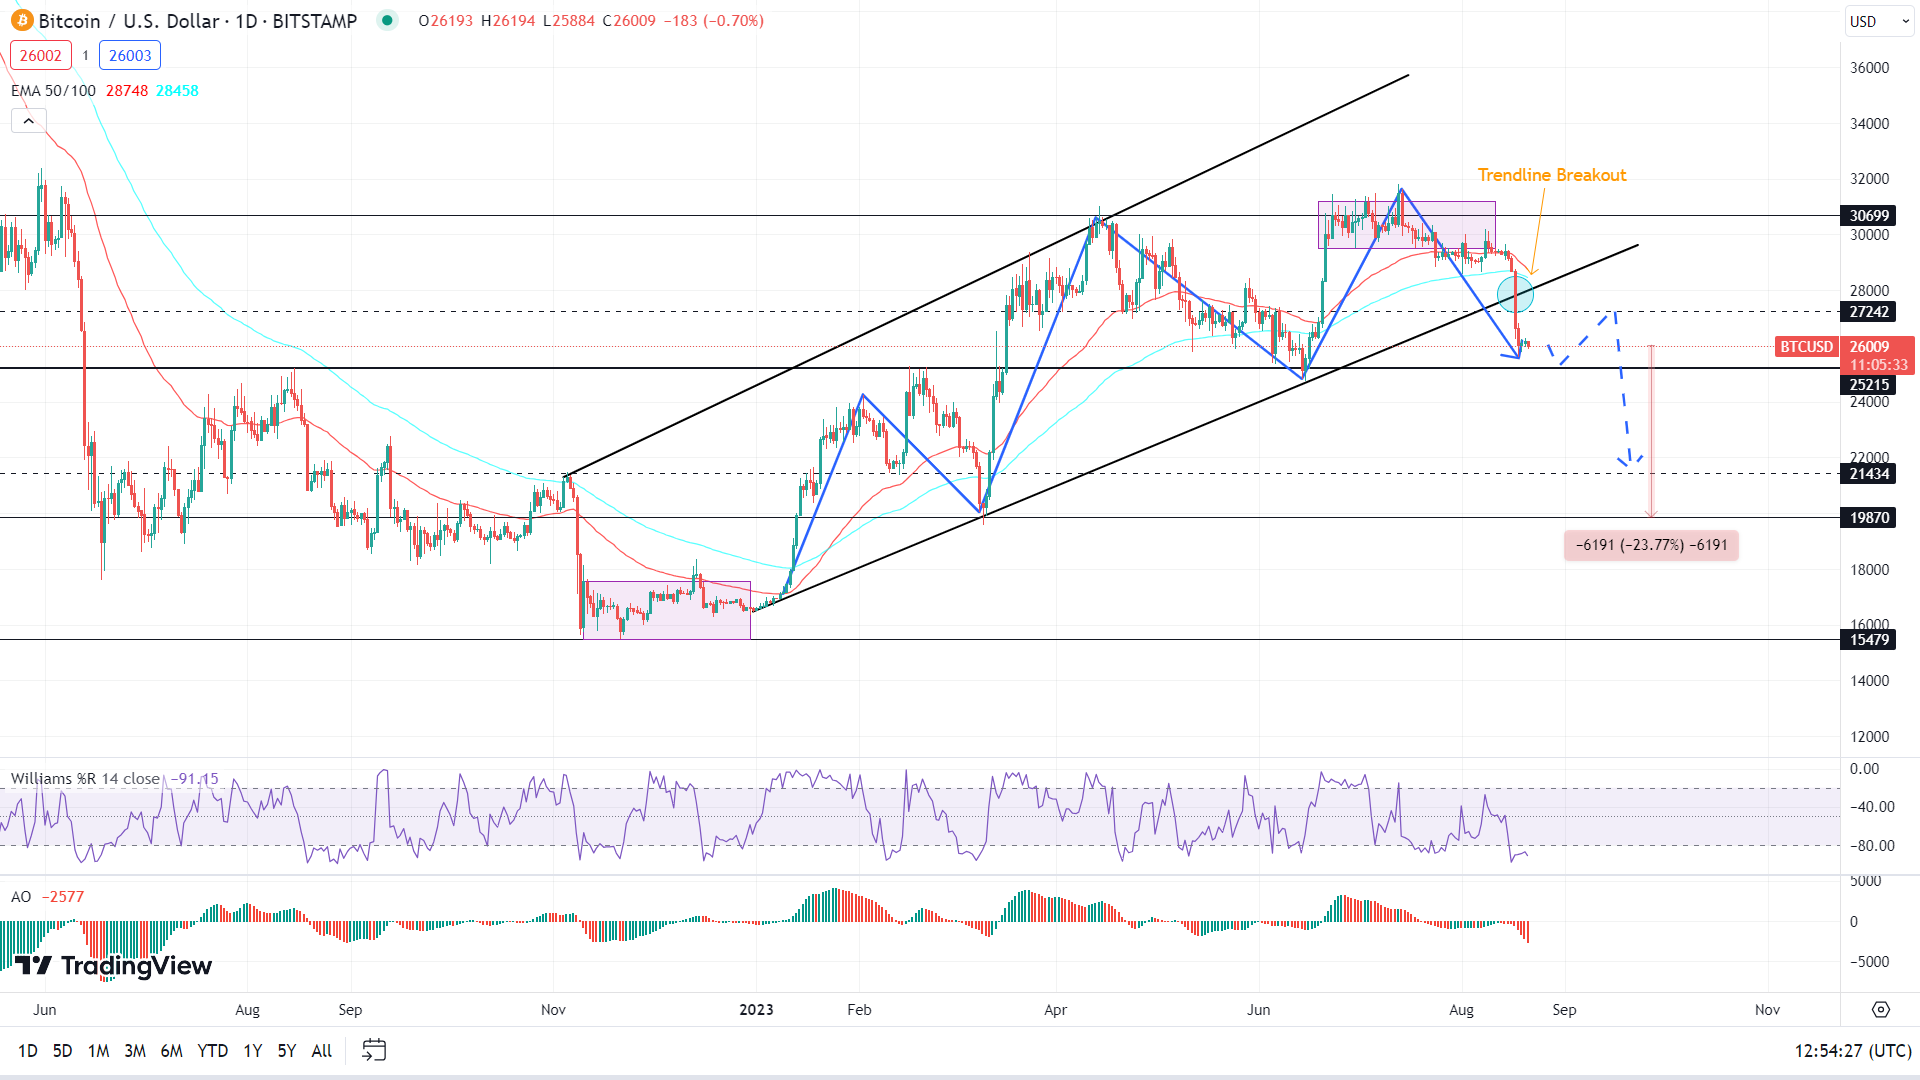
BTC/USD 1-day chart
Conversely, a resurgence by sidelined investors could restore Bitcoin price back into the bullish technical formation, with the potential to breach the $30,699 resistance level.
Also Read: Bitcoin CME gaps at $35,000, $27,000, and $21,000. Which one gets filled first?
Ethereum price could fall amid bearish indicators
Ethereum (ETH) price shows an impending downward trajectory, substantiated by the breach of the ascending trendline. The breach has also led to a dip below the critical support level of $1,687. This development has paved the way for a potential 27% price reduction, potentially reaching the psychological benchmark of $1,200, with intermediate support of $1,366.
Additional technical indicators reinforce these observations. The higher EMA 100 has recently intersected with the lower EMA 50 from a downward perspective, signifying a bearish market trend. Similarly, the histograms of the AO have transitioned to red, with robust bodies positioned beneath the zero line, indicative of heightened selling pressure.
Given this scenario, traders could consider initiating short positions in the market subsequent to a confirmed closure below the $1,620 level.
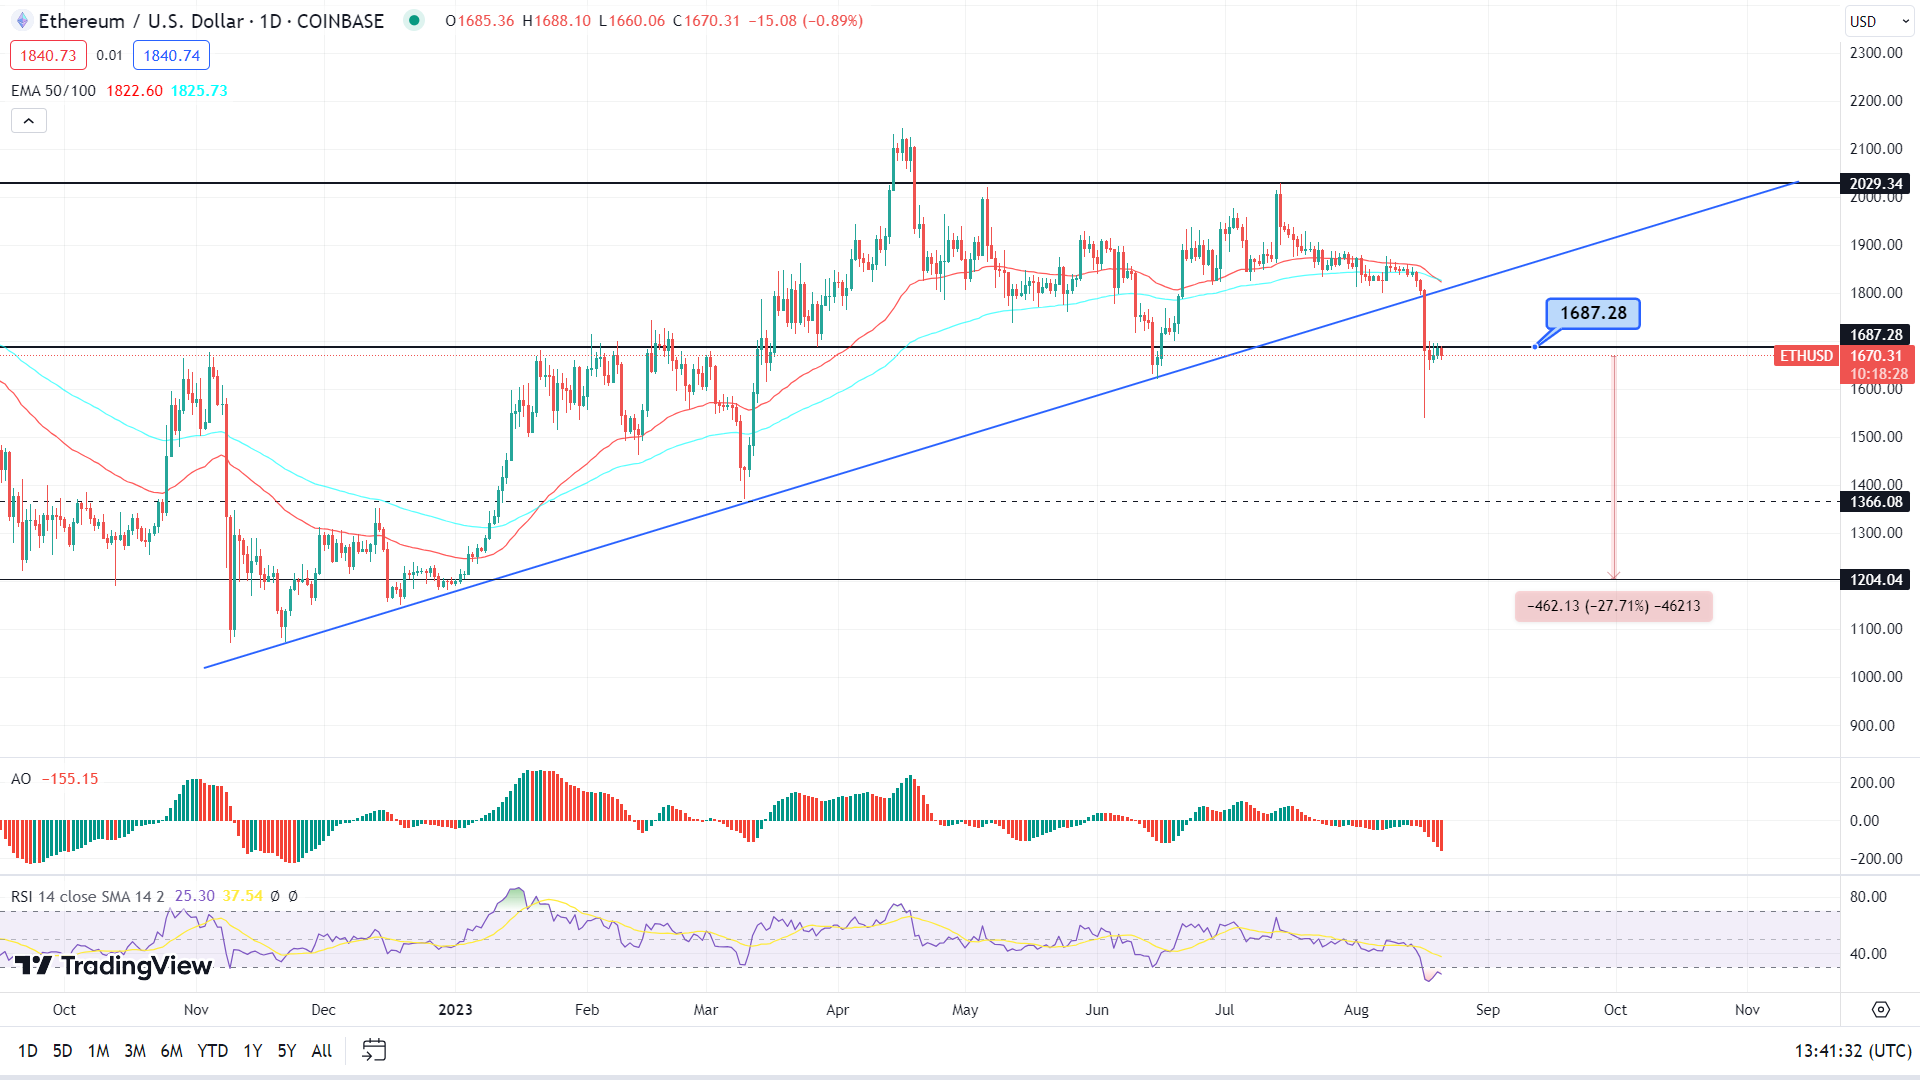
ETH/USD 1-day chat
On the other hand, the position of the RSI within the oversold region points to a forthcoming price reversal. If momentum is nurtured, Ethereum price could steadily restore above the $1,687 support level and elevate to a level above the ascending trendline in a highly bullish case. Such a move would increase the chances of a continued uptrend, with a decisive foray above $2,029 confirming the uptrend.
Also Read: SEC could approve multiple Ether ETFs soon while delaying Bitcoin spot ETFs
Ripple price eyes key levels as the downtrend continues
Ripple (XRP) price reflects a significant retracement of the recent gains accrued after the favorable resolution of the SEC case. At present, indications of a continued downward trajectory are becoming apparent. The current price movement closely follows the path delineated by the 200-period Exponential Moving Average (EMA).
The broader context conveyed by various indicators suggests a likelihood of further price depreciation, potentially reaching the $0.411 level. This level holds significance as the second support threshold, coinciding with the lower boundary of the channel (denoted by the blue color) initiated in June. Should this level prove inadequate in upholding the value of XRP, an extended descent toward the $0.287 level becomes probable, signifying a substantial decline of approximately 45% from the current price.
An analysis of the MACD histograms shows the continuation of the southerly trajectory, substantiated by the histograms consistently manifesting in the negative region below the zero line. Furthermore, the Stochastic Oscillator’s northward orientation corroborates the prevailing bearish sentiment.
Per this analysis, the recommended course of action involves awaiting confirmation of price closure below the descending grey trendline before contemplating entry into a short position.
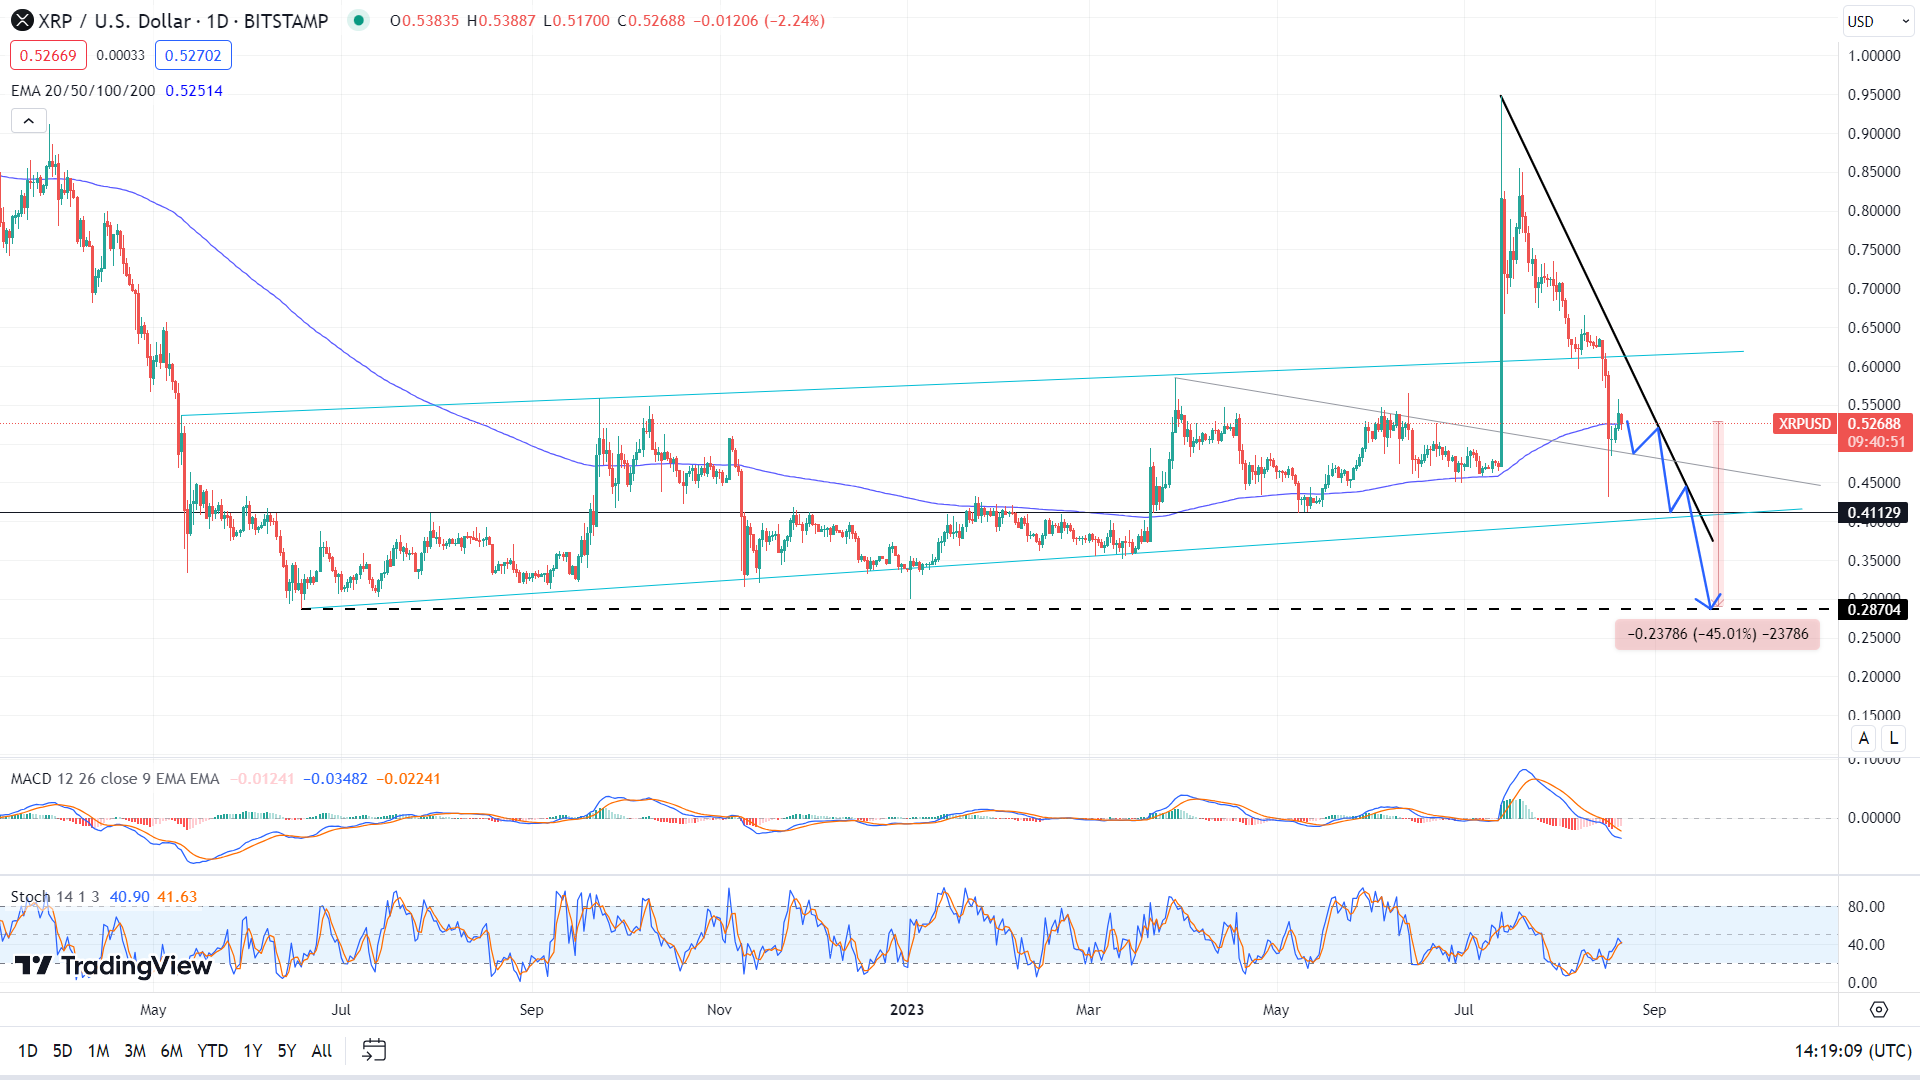
XRP/USDT 1-day chart
Conversely, a descending grey trendline offers preliminary support to the cryptocurrency pair, possibly facilitating a brief retracement. If Ripple price sustains above this line, the odds of a move north increase. However, invalidation of the current bearish outlook would only occur once XRP surpasses the upper boundary of the chart pattern.
Also Read: XRP price rally to $0.60 likely with recovery fueled by developments in SEC vs. Ripple lawsuit


