

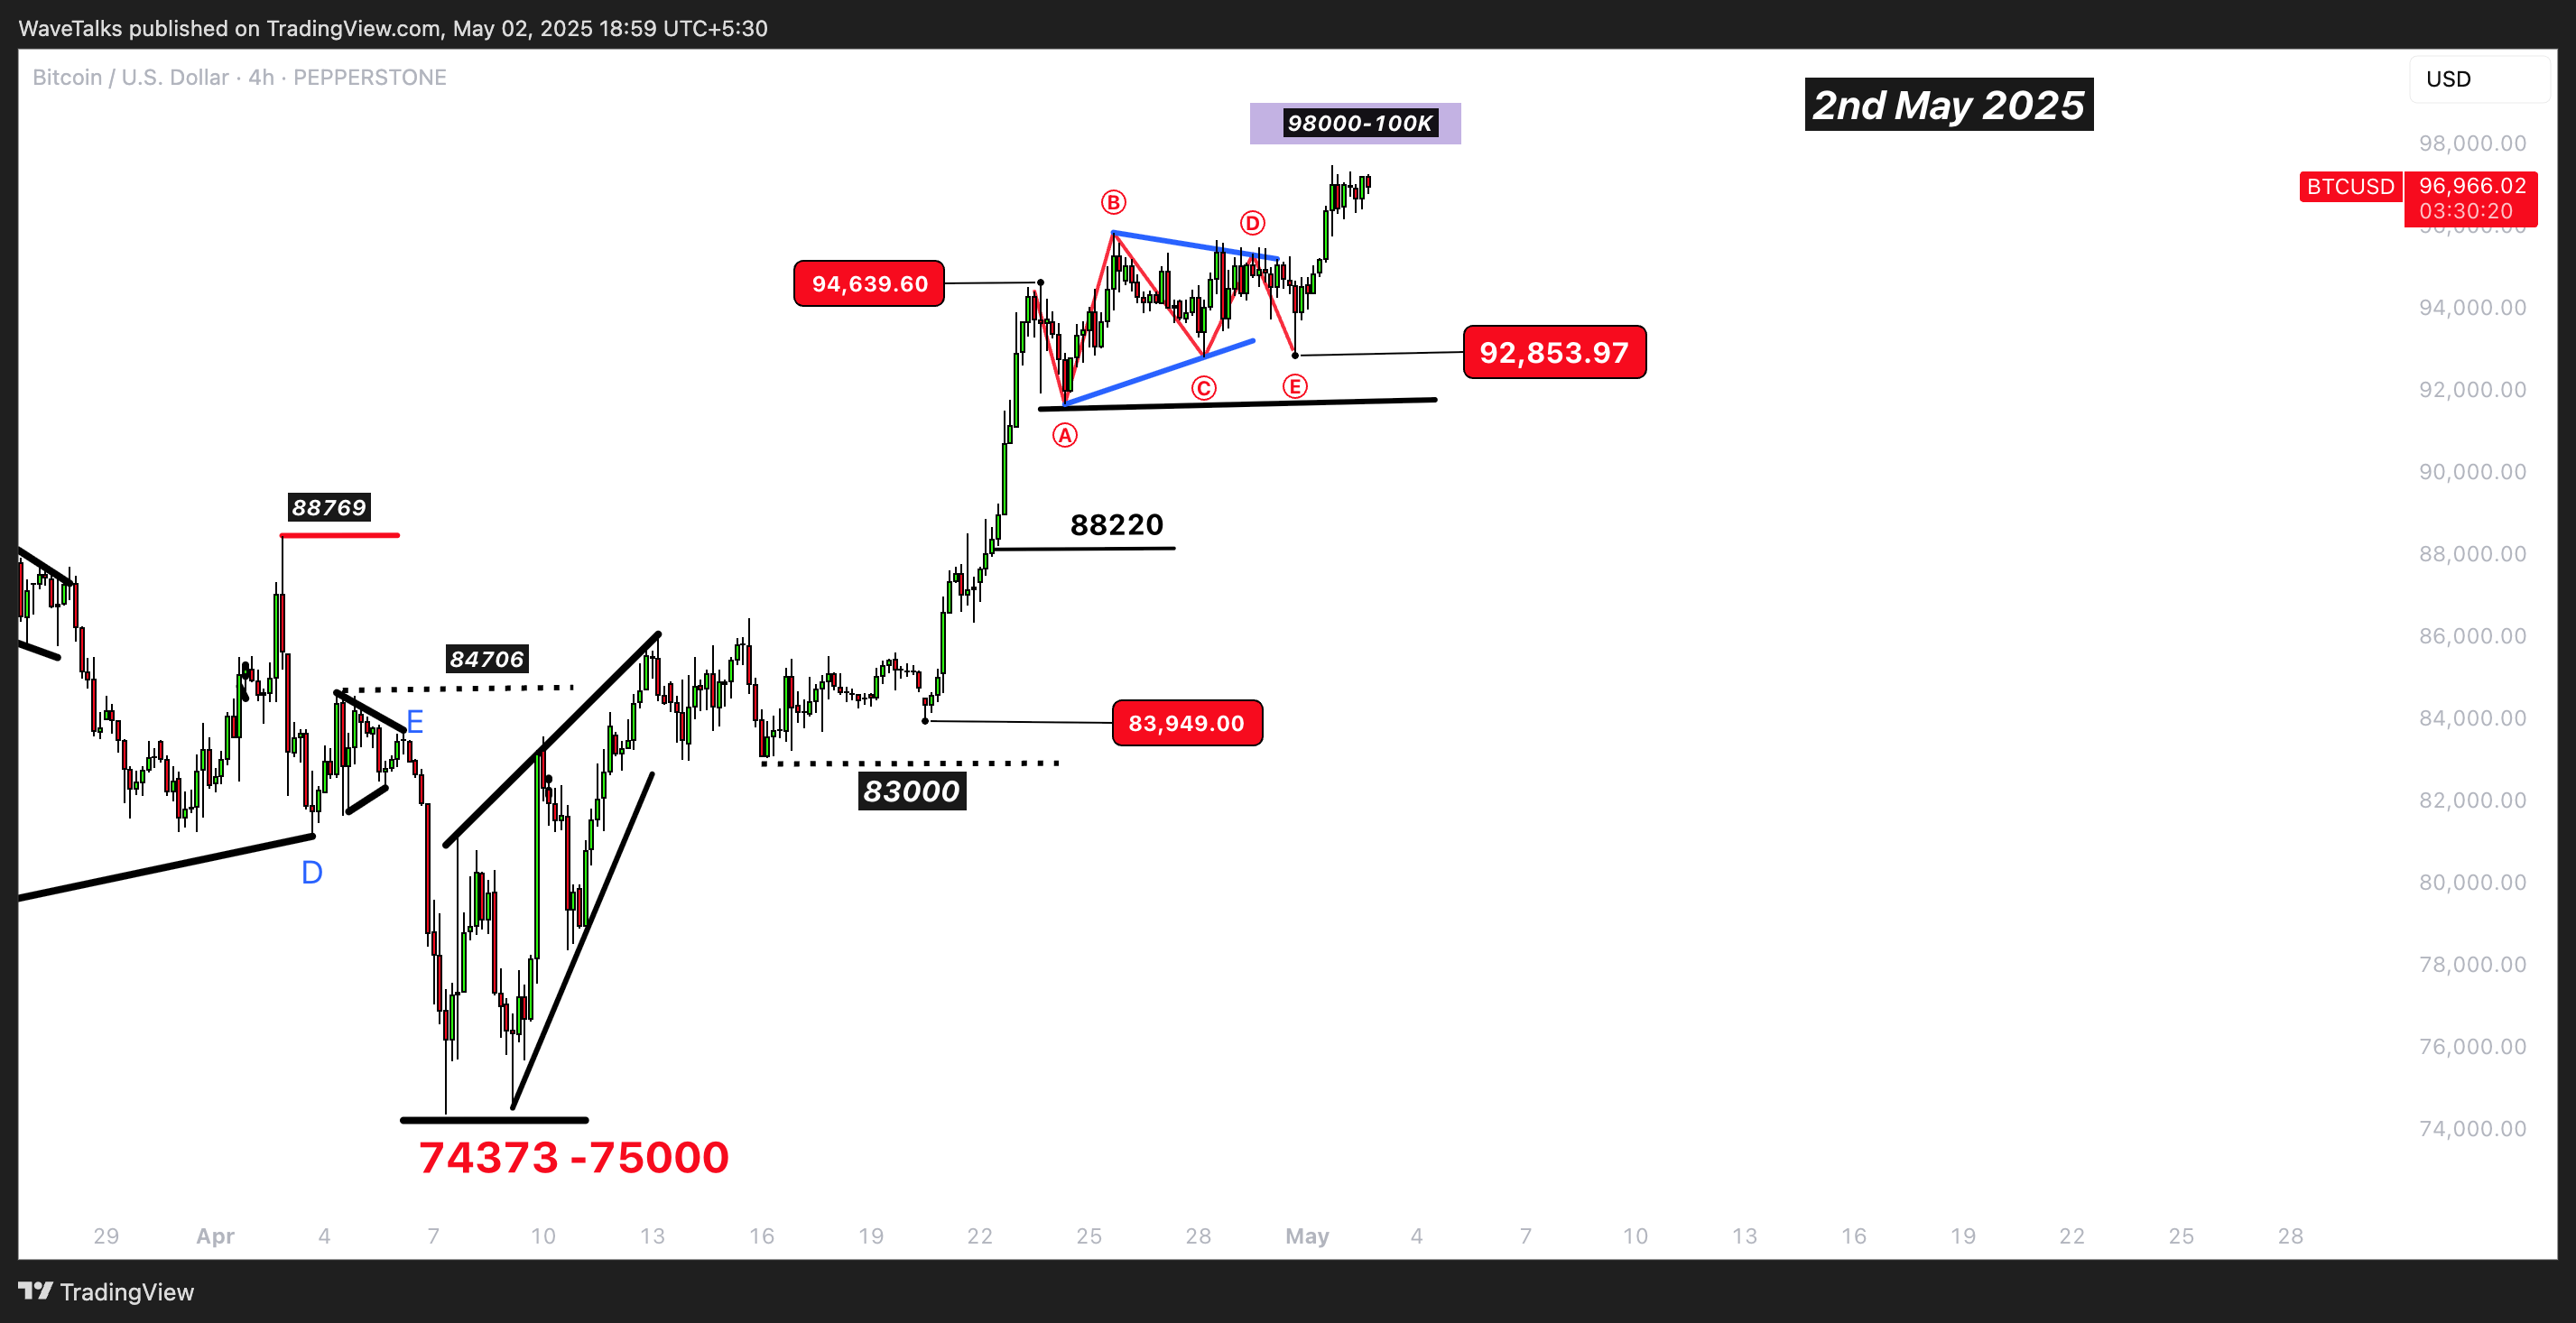
In our last update, we highlighted a potential contracting triangle unfolding between 91K–95K, with a breakout expected. And it played out beautifully.
Bitcoin found its E-wave bottom near 92,853, just above Wave A, as anticipated. Since then, it’s been pushing higher, and now it’s approaching the crucial 98K–100K resistance zone, the same area we marked as the likely target post-breakout.
Triangle thrust playing out – But caution ahead
The breakout above 95K has likely kicked off the triangle thrust phase, which often travels fast and sharp. But as we approach 98K–100K, traders should be cautious. This is a logical resistance zone, and a pullback from here could send prices back toward the 90K–92K region.
If 90K–92K fails to hold, the structure could stretch deeper into 88K territory, calling for a fresh wave review.
Global correlation still alive?
Interestingly, Bitcoin’s movement continues to correlate with global indices. As Bitcoin tests resistance, Nifty and S&P 500 are also approaching key zones. Could this be another risk-on phase, or are we nearing a short-term top?
Key Bitcoin Levels:
-
92.8K: E-wave bottom (confirmed).
-
95K: Previous breakout trigger.
-
98K–100K: Immediate resistance zone. Reversal possible here.
-
90K–92K: Pullback support zone. If broken, watch 88K next.
-
Above 102K–109K: Only if the thrust extends with strong momentum.
Conclusion:
The triangle played out well. Now Bitcoin stands at the edge of the sky, singing its bullish tune. But traders beware—the 98K–100K zone is where the real test begins.
WaveTalks – Market Whispers! Can you hear them?


