

Bitcoin Fundamental Forecast: Neutral
- BTC/USD restricted by rising yields and USD strength.
- Bitcoin withstands headwinds but can prices break the current range?
- BTC volatility falls below stocks for the first time since 2020.
![]()

Recommended by Tammy Da Costa
Get Your Free Top Trading Opportunities Forecast
Fed Pivot, Rising Yields and USD Strength – What’s Driving Markets?
As the Federal Reserve continues to raise rates at the most aggressive pace since the 1980’s, rising yields and USD strength does not bode well for risk assets.
In an environment where persistent inflation, hawkish central banks and economic uncertainty continue to drive sentiment, cryptocurrency and stocks remain vulnerable to geopolitical risks.
Visit DailyFX Education to learn about the role of central banks in global markets
After losing 74.5% of its value since the November high of $69000, a rebound off the June low ($17592.78) allowed bulls to drive prices higher before reaching another barrier of resistance at $20000.
![]()

Recommended by Tammy Da Costa
Get Your Free Bitcoin Forecast
Although cryptocurrency is known for its erratic behavior and large price swings, BTC volatility has fallen below that of US stock indices for the first time since 2020.
With markets already pricing in another 75-basis point rate hike in November, any surprises from the economic calendar or a break of the current range may allow Bitcoin to establish a fresh directional bias.
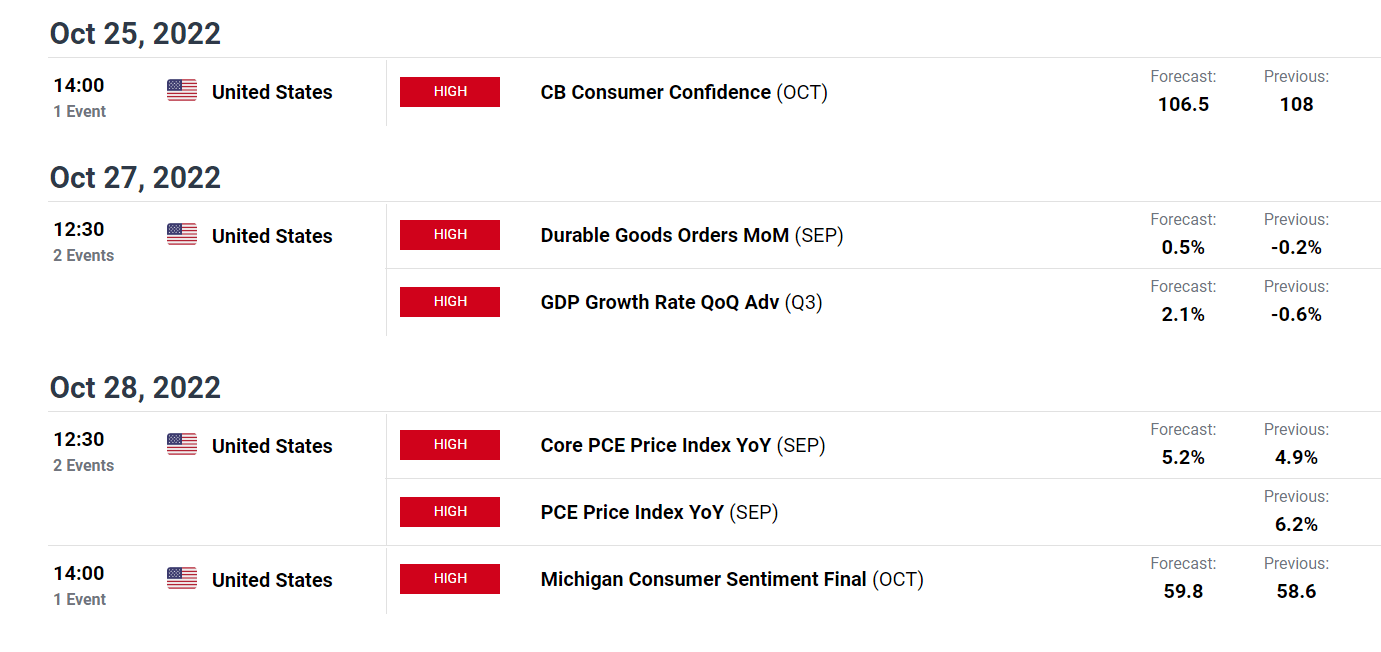
DailyFX Economic Calendar
Bitcoin (BTC/USD) Technical Analysis
With recent price action consolidating between $18183 (Monthly low) and $19666 (Dec 2017), additional selling pressure and an increase in bearish momentum below $17592 (June low) could see prices falling back towards $16000.
Bitcoin (BTC/USD) Weekly Chart
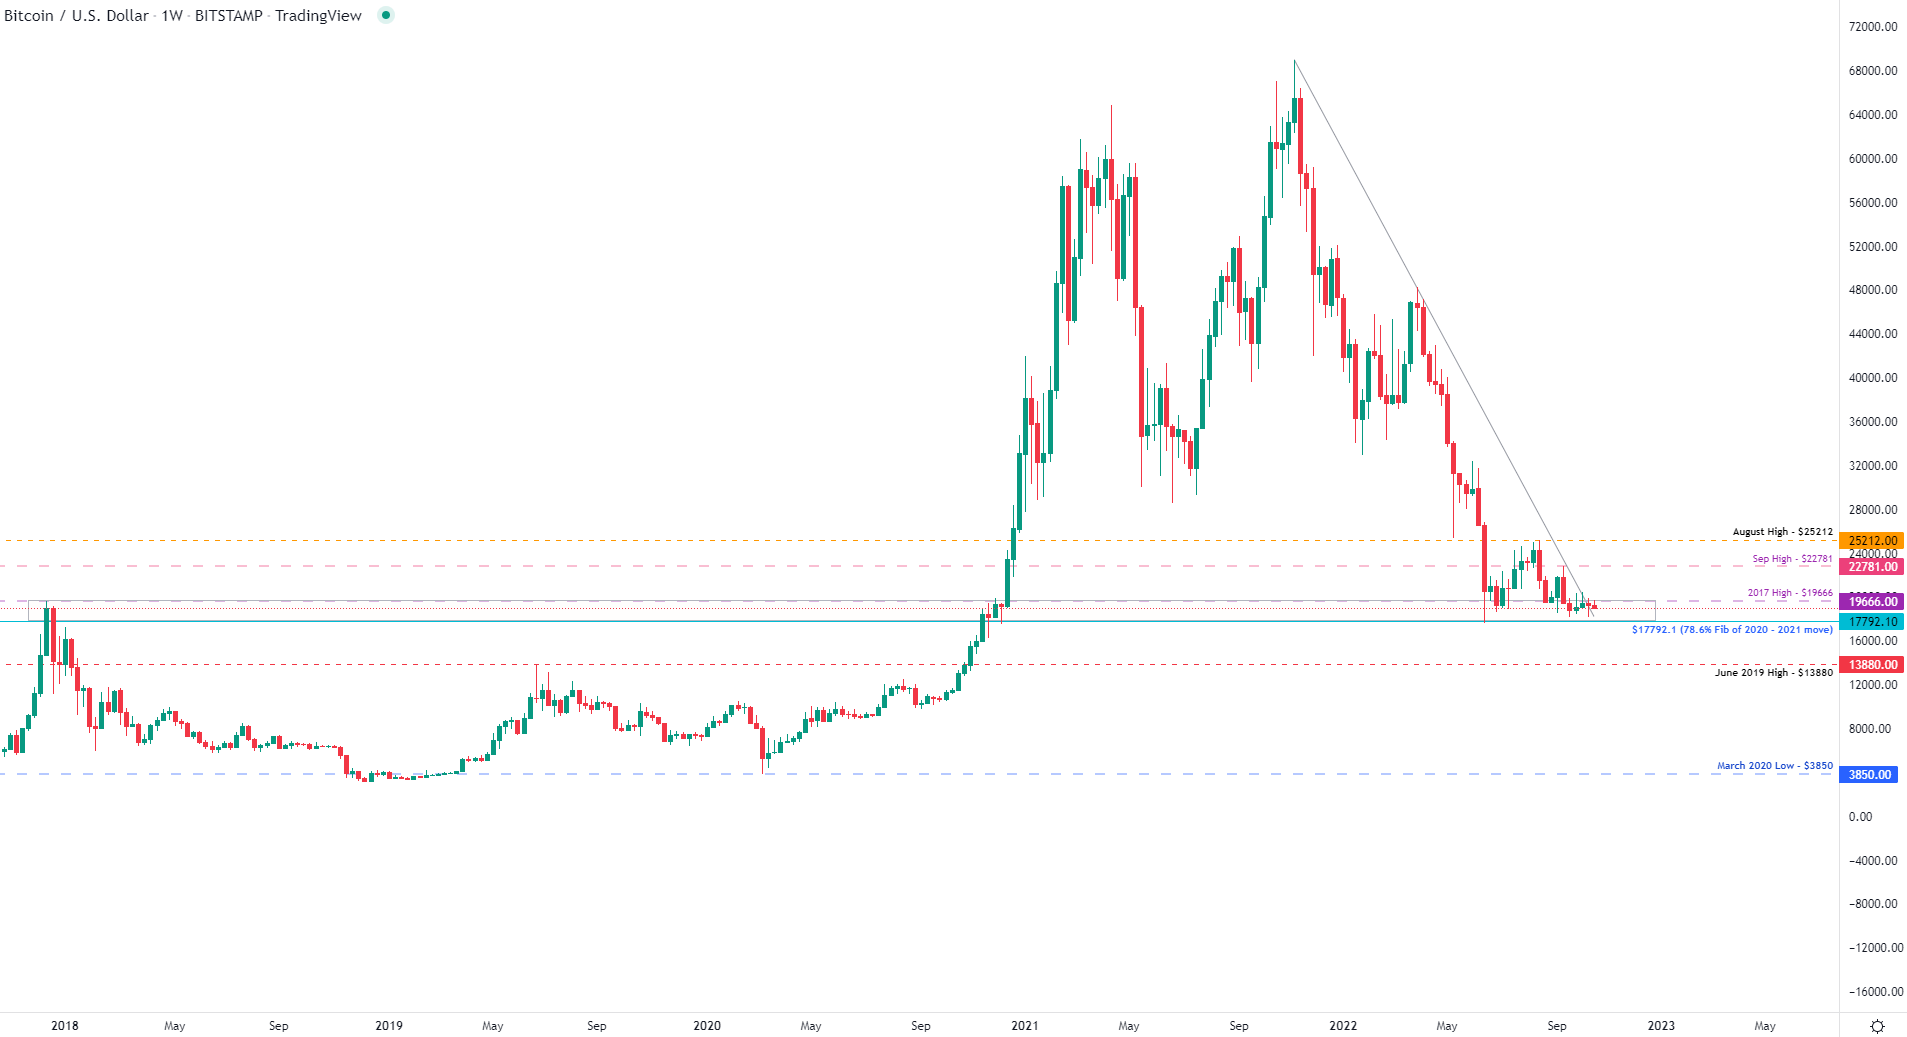
Chart prepared by Tammy Da Costa using TradingView
Bitcoin Key Levels
| Support | Resistance |
|---|---|
| S1: 18183 (Current monthly low) | R1: 19666 (Dec 2017 high) |
| S2: 17792.1 (78.6% Fib 2020 – 2021 move) | R2: 20000 (Psych level) |
| S3: 17592.78 (June low) | R3: 22718 (September high) |
Trade Smarter – Sign up for the DailyFX Newsletter
Receive timely and compelling market commentary from the DailyFX team
Subscribe to Newsletter
— Written by Tammy Da Costa, Analyst for DailyFX.com
Contact and follow Tammy on Twitter: @Tams707


