Bitcoin (BTC) whales have been selling their assets aggressively while retail investors have been accumulating the coins simultaneously throughout 2022.
Bitcoin whales are defined as holders with more than 1,000 BTC, while retail traders are holders with one BTC or less.
CryptoSlate’s previous research highlighted that retail investors’ BTC holdings since 2018 have doubled to 3 million from 1.5 million. On the other hand, whales have seen their BTC holdings decline from around 10 million to 9 million within the same time frame.
Is this bullish or bearish for the market?
Several market analysts hold divergent views on what this means for Bitcoin. However, most agree that whale selling usually suggests a bearish sign for the BTC’s price.
In most cases, the actions of these holders greatly influence the price. Since whales have the most supply, their dumping increases the available supply and shows a decline in their conviction which could influence others to exit their positions.
Meanwhile, there is also an upside to this, which is a more distributed Bitcoin network. When more people hold BTC, the asset is more resistant to the actions of whale investors. Maartunn said this scenario was perfect, but achieving it could take a long time.
Another analyst Seth Michael Steele said:
“Whales are selling, but retail is buying!!! Seems backwards but this will be good for more distribution among investors. Bitcoin shrimp picking up slack for whales is beautiful to watch!”
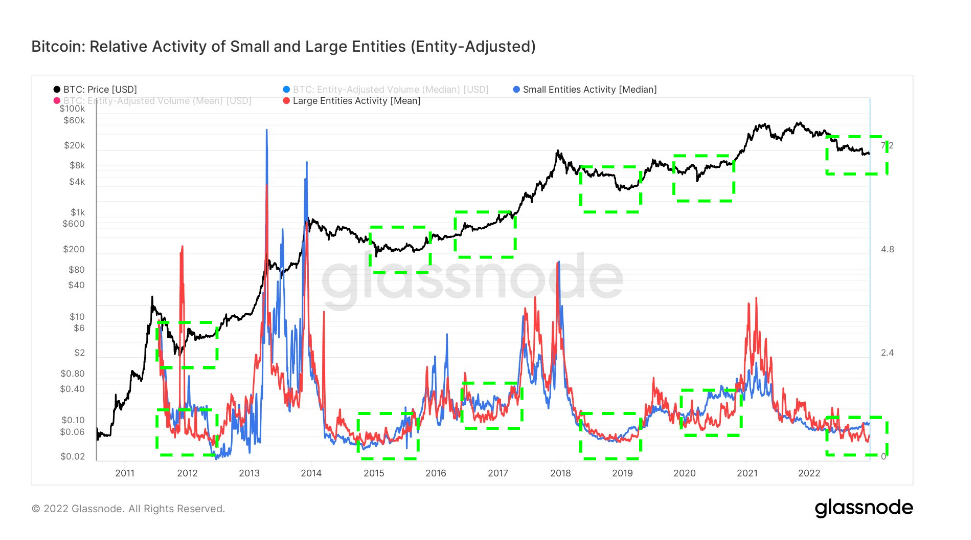
Meanwhile, the recent sell-offs and accumulation could signify that Bitcoin is near the bottom of this bear market cycle. Usually, when small entities are more active in accumulation than small entities, the bottom is near.

CryptoSlate’s analysis of Glassnode’s relative activity of small and large-scale entities since 2012 showed that the market bottoms whenever retail activity outstrips whale activity. According to the above chart, this played out in 2012, 2015, 2017, 2019, and 2020.
In all of the highlighted cases, retail investors increased activity marked the market bottom — the chart shows that the same pattern has begun to repeat itself in 2022.


