

XRP remains one of the most interesting and eye-catching options on the alternative cryptocurrency market. Not even a 500% increase in USD valuation in recent months or rumors of an XRP ETF make it one of the main market attractions, but rather how the altcoin continues to behave against the crypto market leader, Bitcoin (BTC).
After skyrocketing 381% at the end of last year and hitting a new multi-year high of 0.000033 BTC for one XRP coin, the latter has slowed down against its biggest counterpart which, to be honest, was expected.
Related

However, what can be seen on the XRP/BTC chart can either be called a correction or an accumulation, depending on how you feel about these two crypto giants.
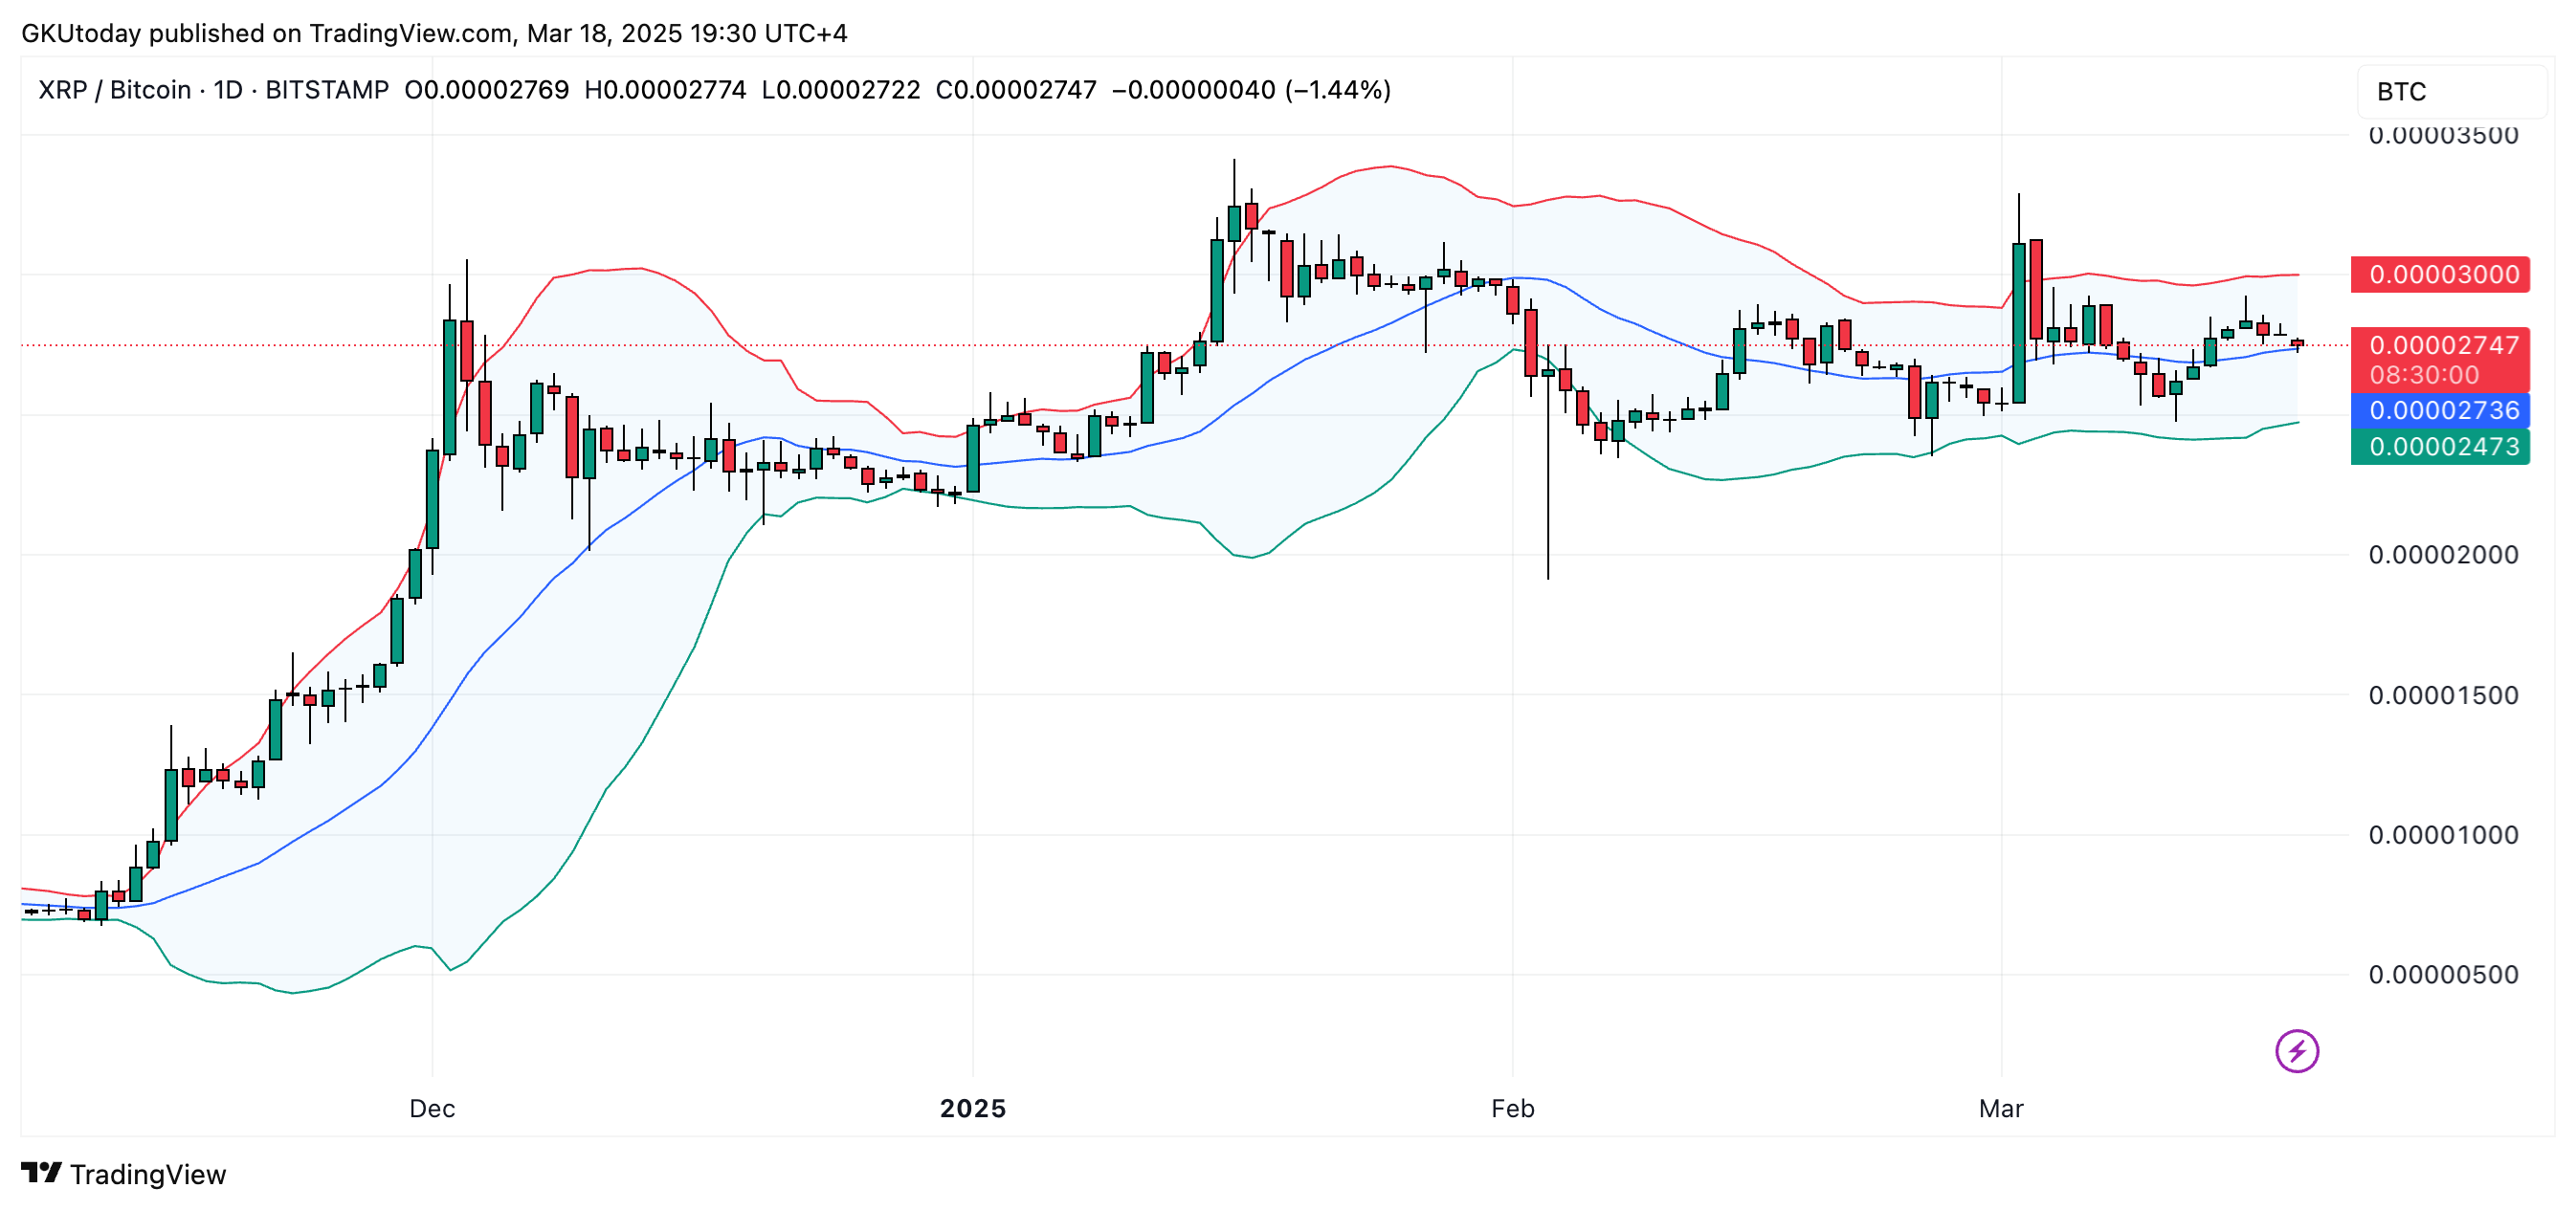
Fortunately, technical analysis indicators have no bias toward any asset and can interpret a market picture more clearly and as it is. One of the most popular tools for this – the Bollinger Bands – indicated that XRP is still strong against Bitcoin.
Related
Such a conclusion was prompted by the fact that, on the daily time frame, XRP managed to test the middle band, see the buyers’ reaction and hold above it. This is a good sign that bulls are interested in buying XRP against Bitcoin at this point, and what we are likely to see is probably accumulation of the altcoin.
In other words, if XRP continues to find strong support at these levels, it may see another leg higher against BTC. Considering that we are looking at the daily time frame, the forecast is more medium term.
Related

Thus, in conclusion, it could be said that as long as XRP is in the 0.0000247-0.00003 BTC range, and especially higher than 0.0000273, the bullish bias for it against Bitcoin remains valid.


