

After a slight recovery from yesterday’s decline, XRP is currently trading at $2.19, displaying concerning weakness as the asset teeters perilously close to the $2.00 threshold. Earlier this week the asset dropped as low as $2, and although today’s recovery may provide a brief sense of relief, the bigger picture is still precarious.
The daily chart’s descending channel is still directing XRP’s price movement with lower highs and lower lows, validating the long-running downward trend. Any short-term bullish hopes were essentially dashed by the recent rejection at the 26 and 50 EMA zone, which is close to $2.35-$2.41. XRP stays trapped in a bearish structure until this range is clearly broken. The closer XRP is to the 200 EMA, which has served as crucial support in recent months and is currently trading at $1.94, the more worrisome it is.
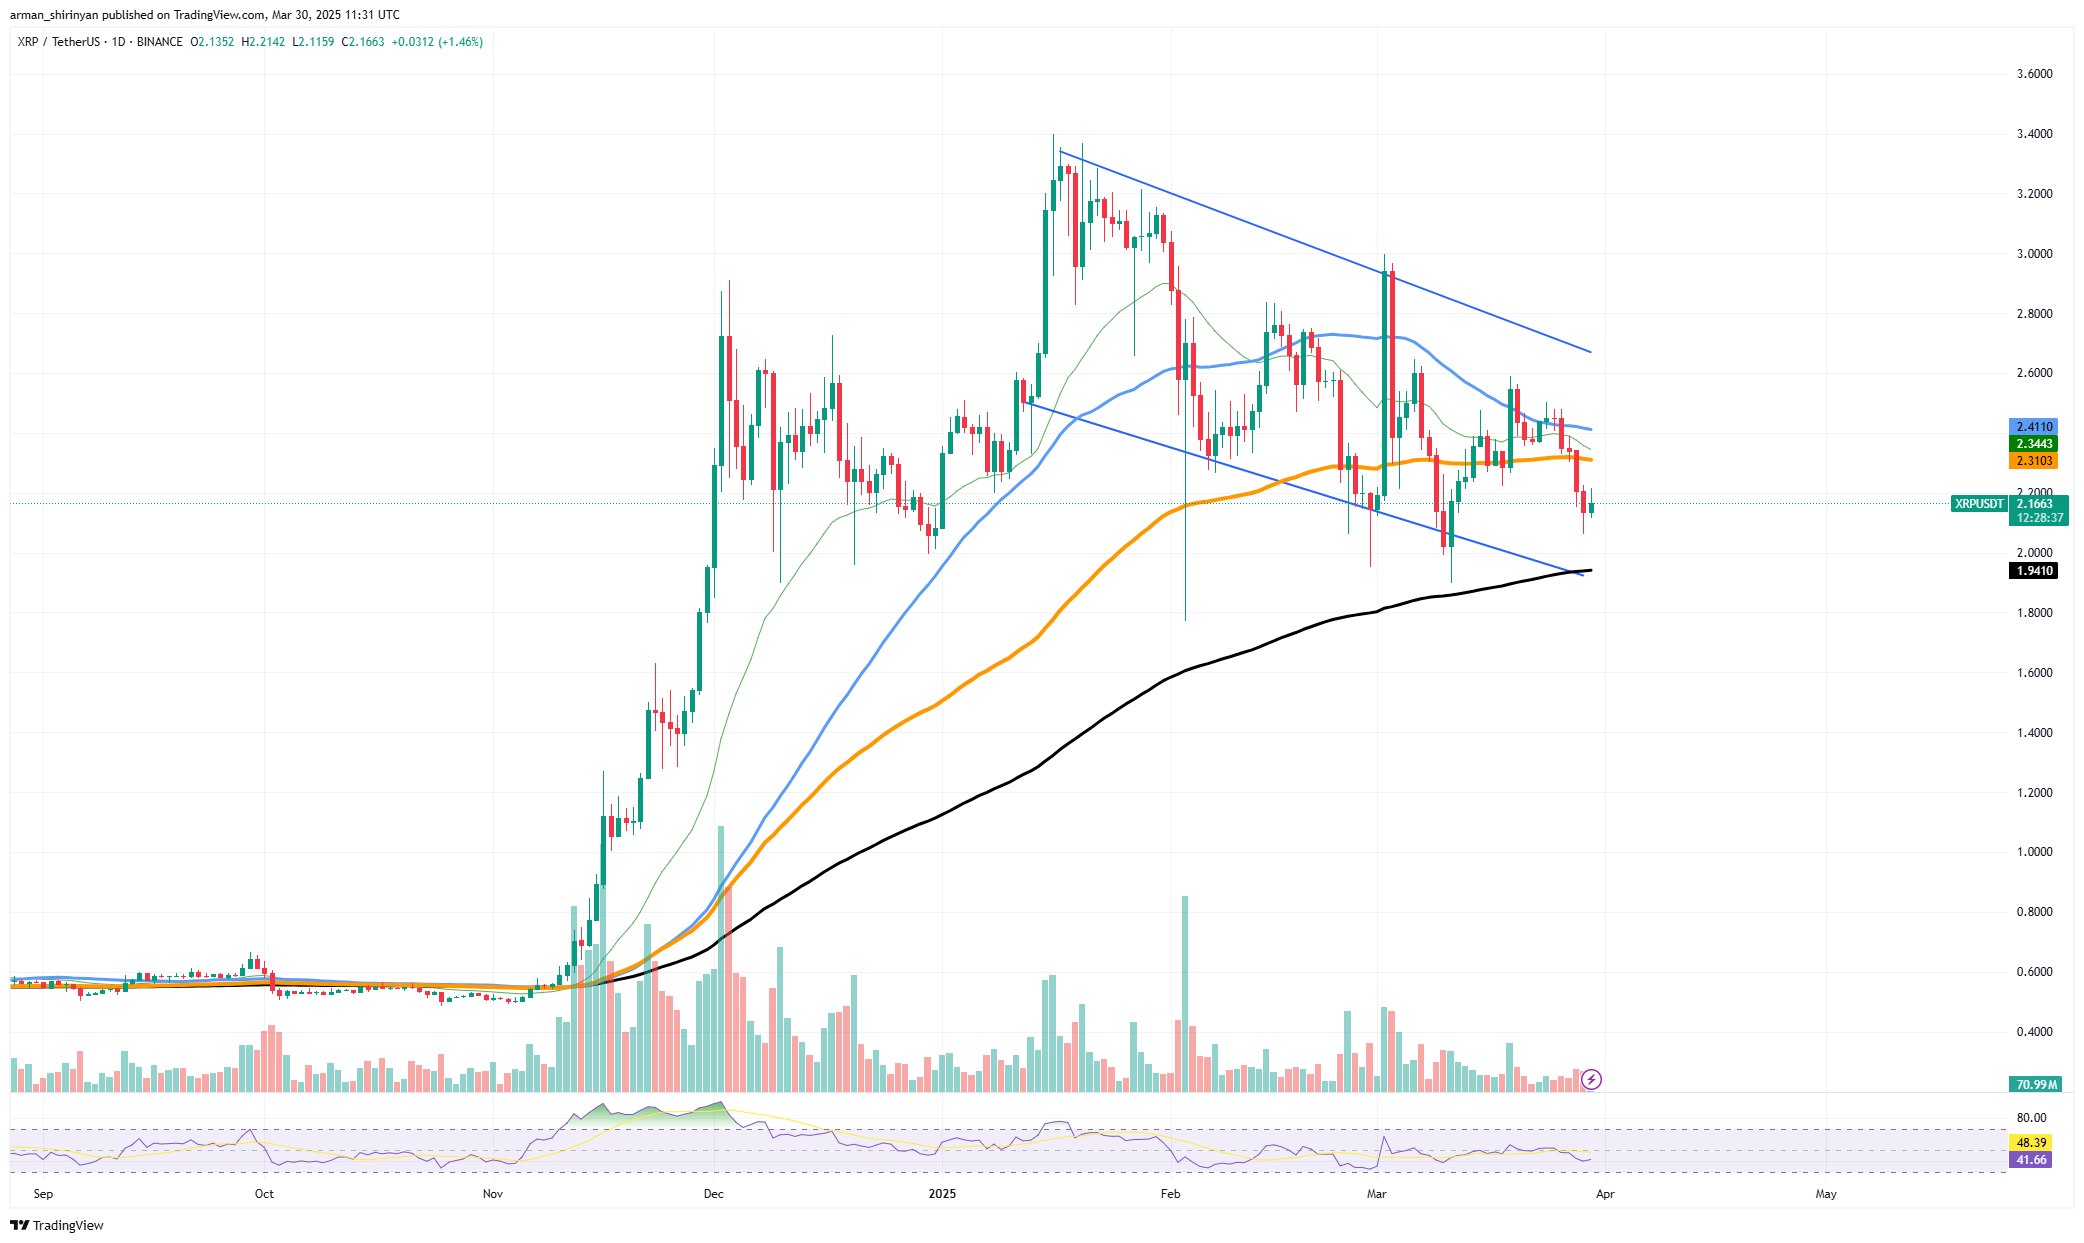
In addition to erasing all of the recovery momentum from Q1, 2025, a breakdown below this level might also trigger a more significant correction toward the $1.75 region. However, a bullish reversal scenario might still occur if XRP is able to maintain above $2.00 in the upcoming sessions and generates some buying momentum.
At 43, which is close to the oversold zone, the RSI suggests that a rebound might be imminent, but only if significant volume is present, which has been lacking during this decline. Whether bulls can maintain $2.2 as a technical and psychological support is crucial to XRP‘s immediate future. The plunge below could quicken if that level is broken, leading to panic selling and testing long-term support zones. A strong bounce with follow-through, on the other hand, might reopen the door toward the resistance level of $2.30.
Shiba Inu falls back
Shiba Inu lost almost 10% of its value and fell back to pre-rally levels, formally wiping out all of its recent breakout gains. At $0.00001273, just above key support, the meme token is currently trading, confirming that its recent surge was a classic fakeout — a brief rally that swiftly collapses, trapping bulls and shaking sentiment. Just a few days ago, SHIB showed promise when the price broke through the 50 EMA and above the resistance level of $0.00001400.
With their sights set on the 100 EMA close to $0.00001640, traders were hopeful that the asset was about to turn around. But as soon as it appeared, the momentum vanished. SHIB was rejected and started to decline instead of buying, which completely erased its short-term breakout gains.
Related

Currently, SHIB’s largest issue is its inability to generate sustainable volume. The rally generated interest for a short while, but there was no subsequent demand. Since then, volume has stabilized, suggesting a lack of broader liquidity that is necessary to support upward price movement as well as low buyer conviction.
Additionally, SHIB is currently hovering around the support zone between $0.00001270 and $0.00001300. The level around $0.00001200, which served as a crucial accumulation level in March, may be the next likely destination if this level breaks. The RSI, which is currently at 43.91, confirms the decline in momentum and offers little hope for a quick recovery.
Bitcoin loses balance
Bitcoin is currently trading at about $83,358 and is balancing just above the crucial $80,000 threshold. Concerns regarding a more severe short-term decline have been raised by the digital asset’s obvious signs of weakness after it broke below the rising trendline that underpinned its most recent recovery.
The 100 EMA, which used to serve as dynamic resistance, is now close to $88,000, and Bitcoin has failed to maintain its position above it. It is evident that bulls are having difficulty maintaining any significant upward momentum when this important moving average is rejected. Should Bitcoin lose its hold on the $80,000 region, the recent bullish structure may be completely invalidated.
Related

This bearish thesis is also supported by the volume profile. A lack of buying interest at current price levels is indicated by the volume, which is unimpressive despite the occasional green candle. Momentum is leaning to the bearish side without being completely oversold as further confirmed by the Relative Strength Index (RSI), which is currently trading close to 44.17.
If Bitcoin breaks below $80,000, the next crucial support is located close to $76,000 and then $72,000, which were both important areas for accumulation in previous corrections. A deeper correction toward $68,000, where the longer-term 200 EMA sits, might be possible if these levels are broken. On the other hand, a move toward $90,000 might still be feasible if bulls can retrieve control and raise the price back above $85,000. Current indicators, however, indicate that the downward path of least resistance is still in place.


