

Bitcoin’s price action has been significantly bullish over the recent months, breaking past several resistance levels. However, judging by how the past few daily candles have closed, it’s interesting to see if the bullish momentum can persist.
Technical Analysis
By TradingRage
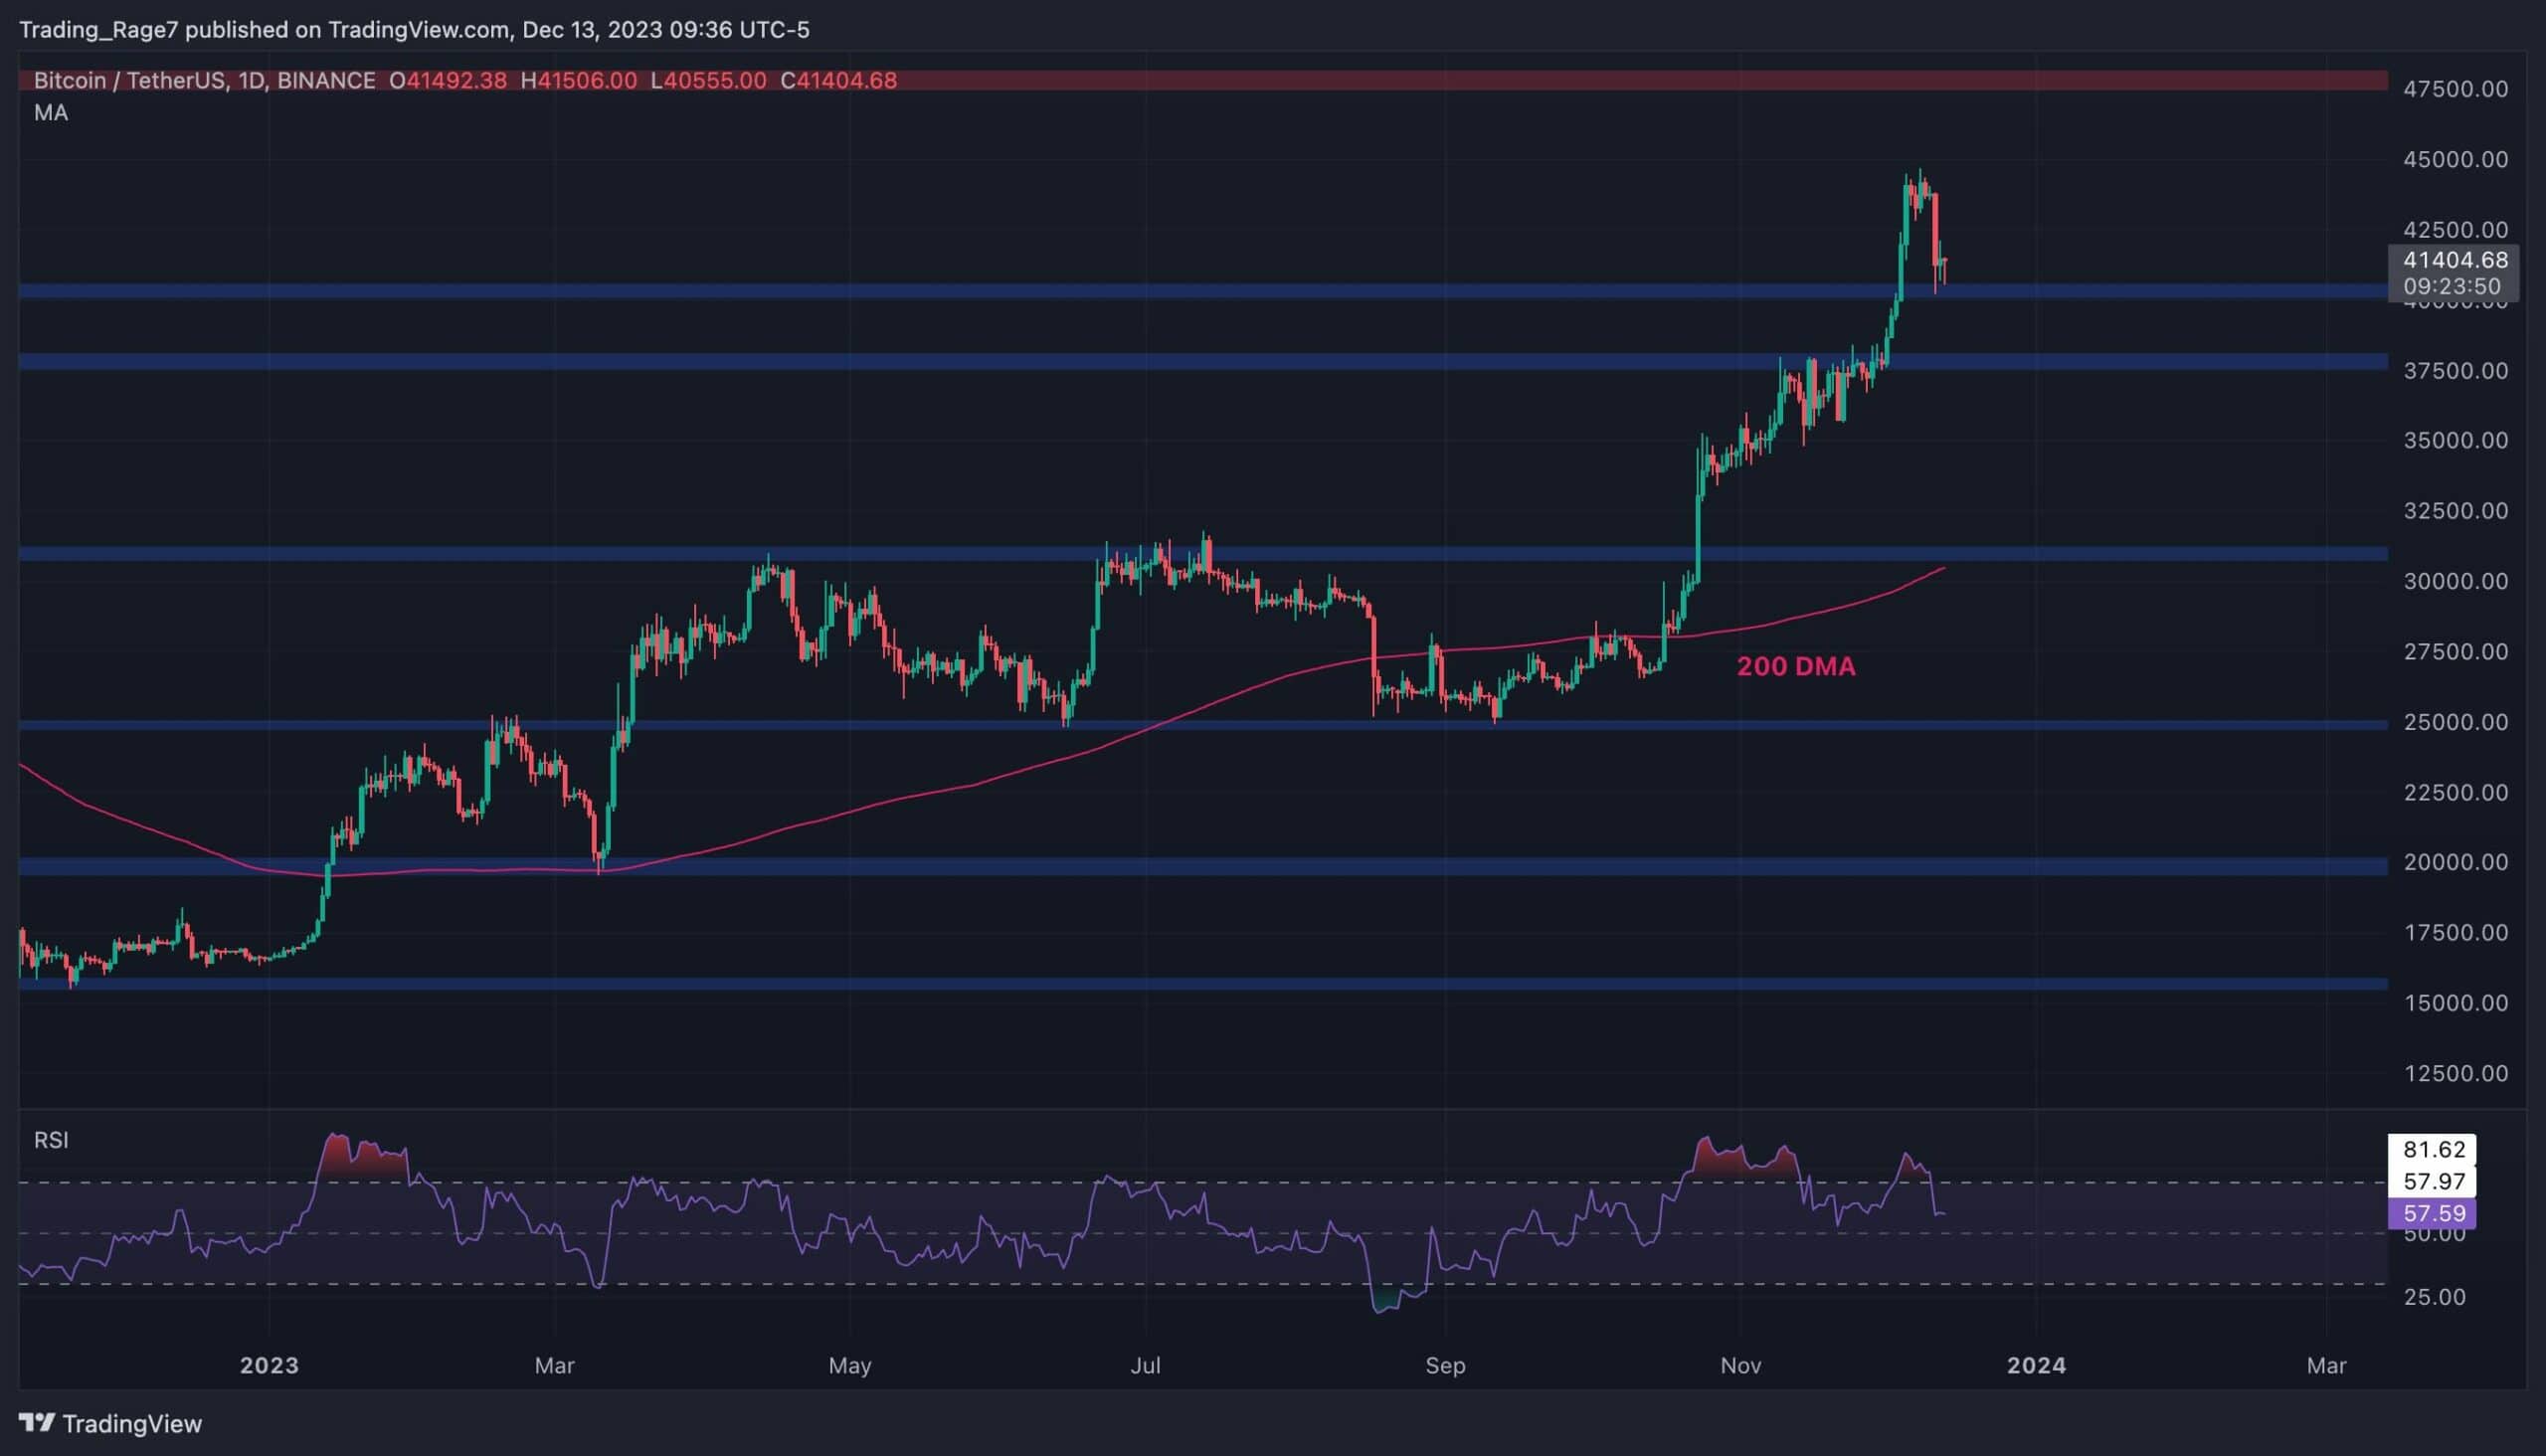
Bitcoin Price Analysis: The Daily Chart
The daily chart shows that the price has broken past the $37,500 and $40K resistance levels since the beginning of November. However, it seems that the market is slowing down, as the price has been acting bearish since the start of this week.
The $40K level is currently being tested, and a breakdown would lead to a potential drop toward the $37,500 area and even the distant 200-day moving average, located around the $31K mark. The Relative Strength Index has also demonstrated a clear bearish signal by dropping below the overbought region.
Nevertheless, BTC’s price has started to recover in the past few hours and it’s interesting to see how far this recovery can go.
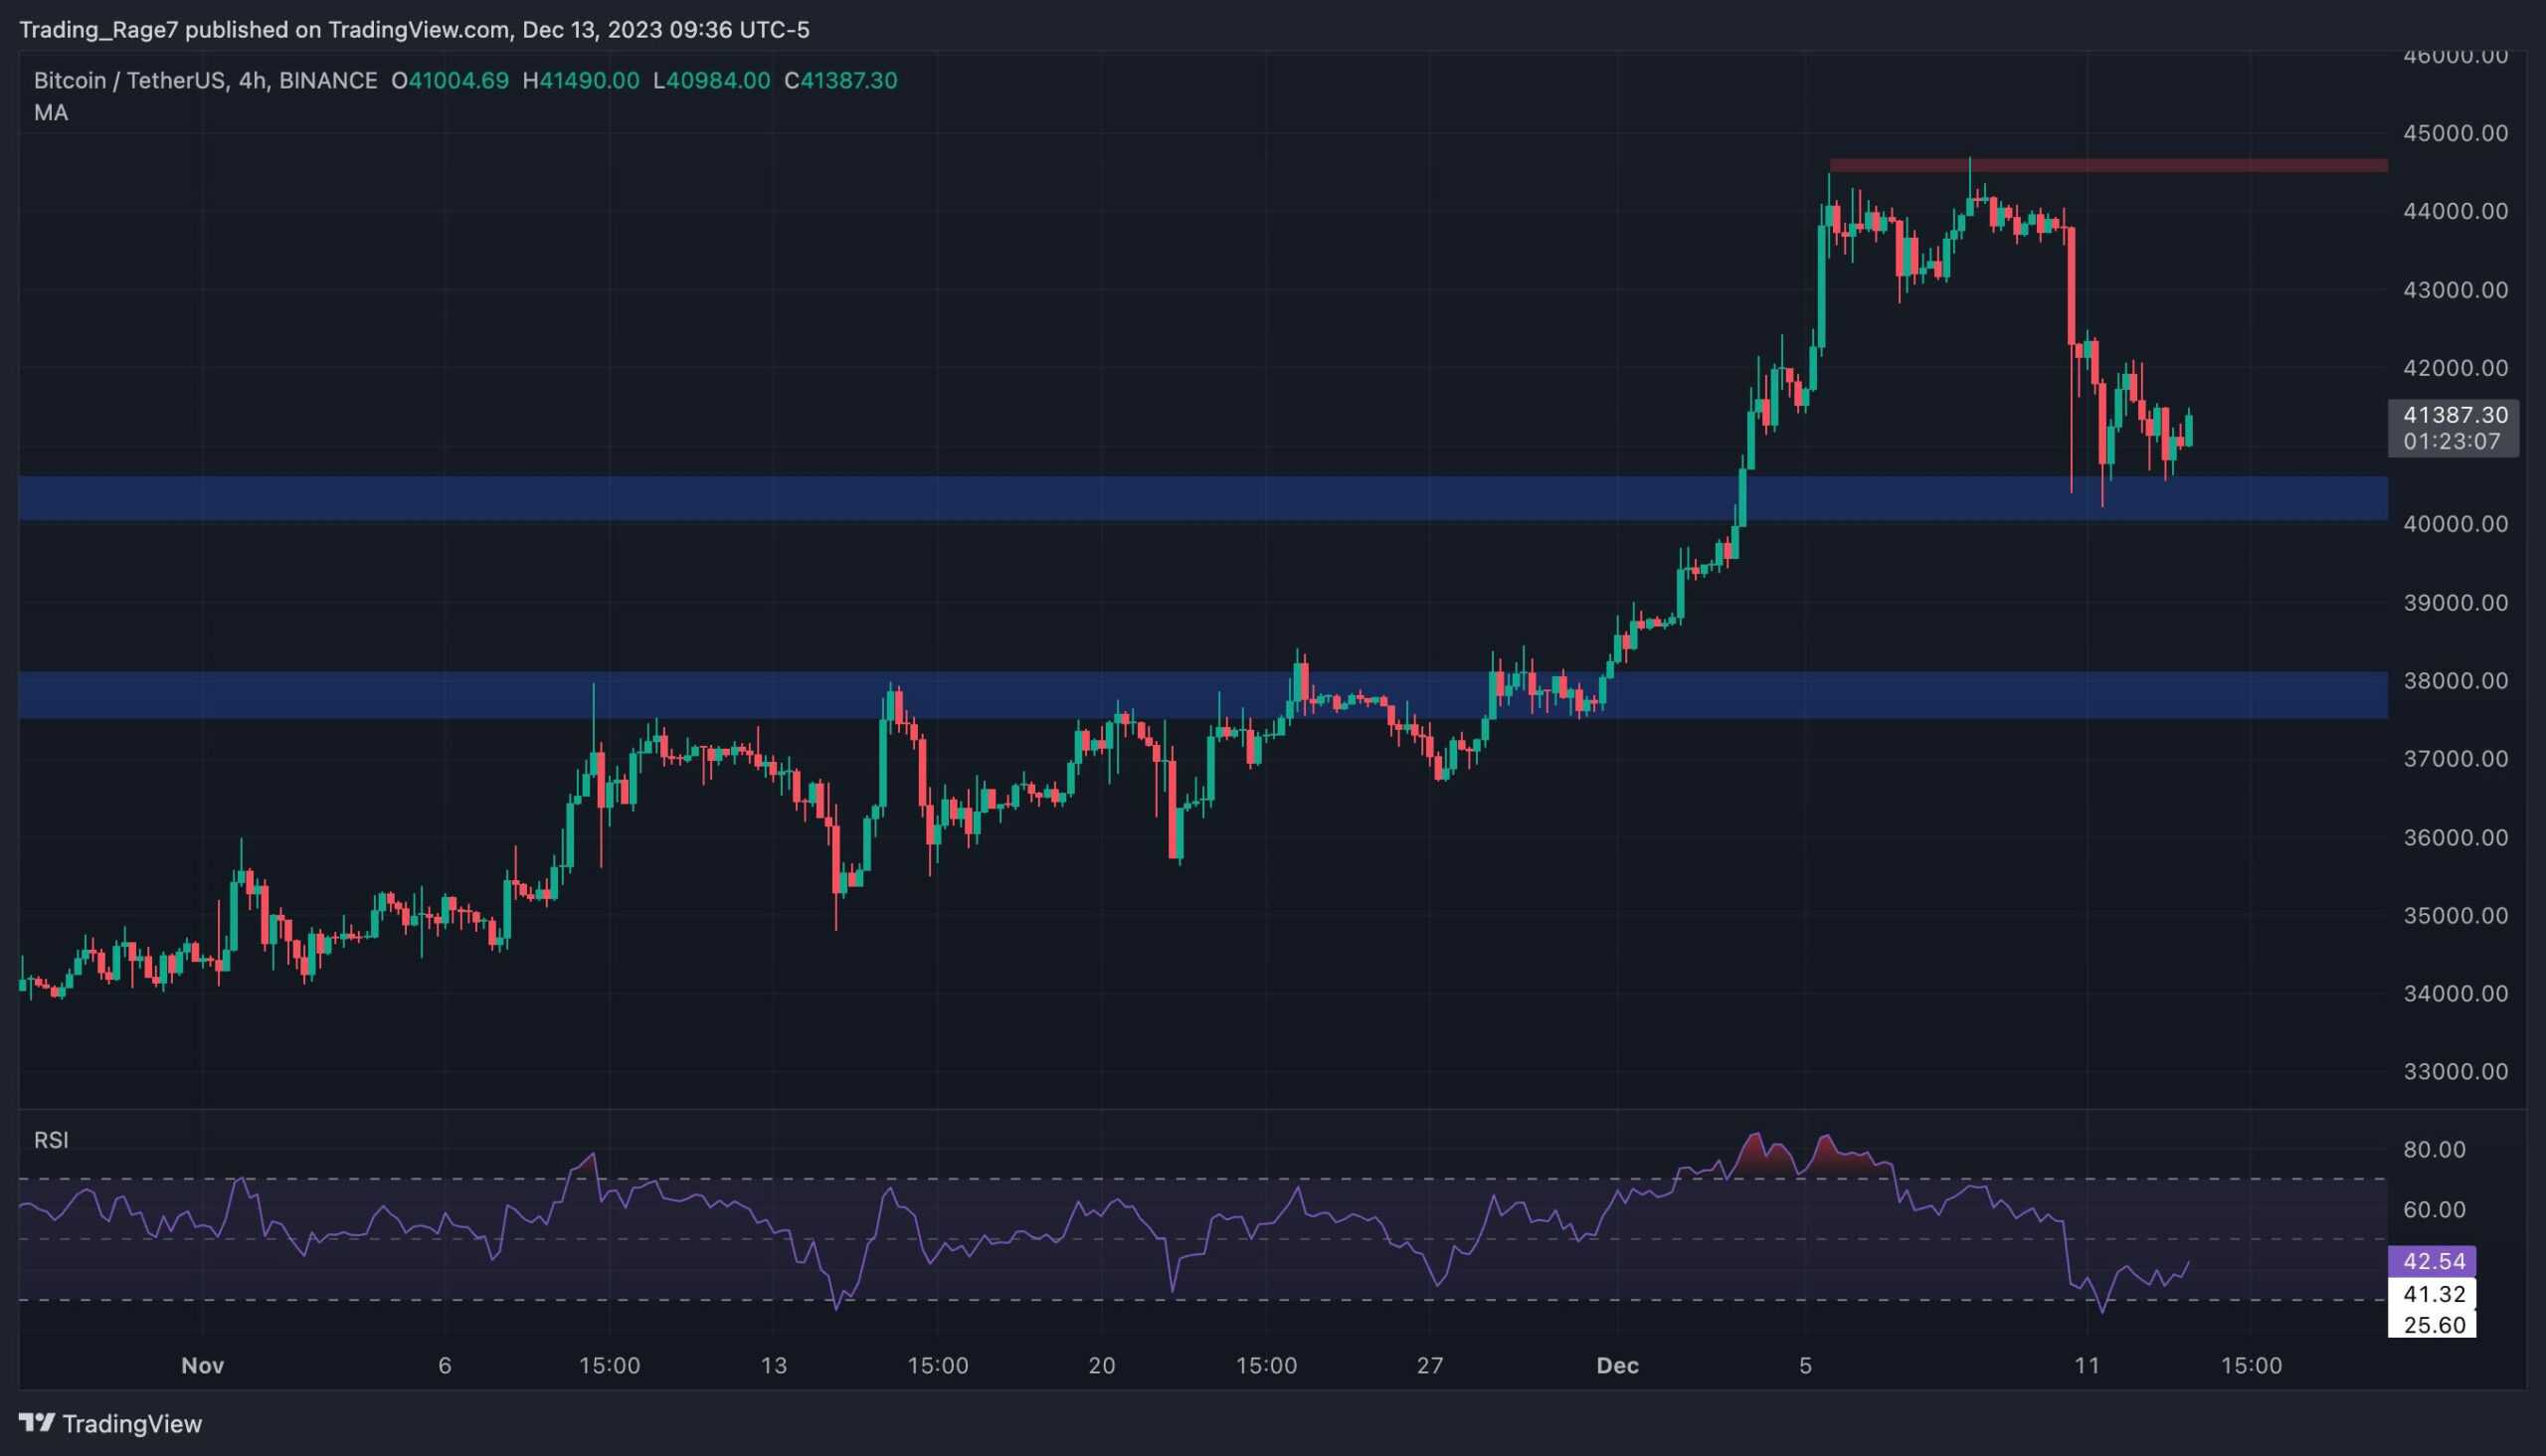
The 4-Hour Chart
The 4-hour timeframe clearly shows what the price has been going through a correction recently. Following weeks of bullish momentum, the market has created a double-top pattern just below the $45K mark and dropped back to the $40K zone.
Yet, the Bitcoin price is seemingly preparing for a rebound from this level and could rise toward the $45K area soon. On the other hand, a breakdown of the $40K support level could lead to a plunge toward the $38K area and even lower in the coming weeks.
On-Chain Analysis
By TradingRage
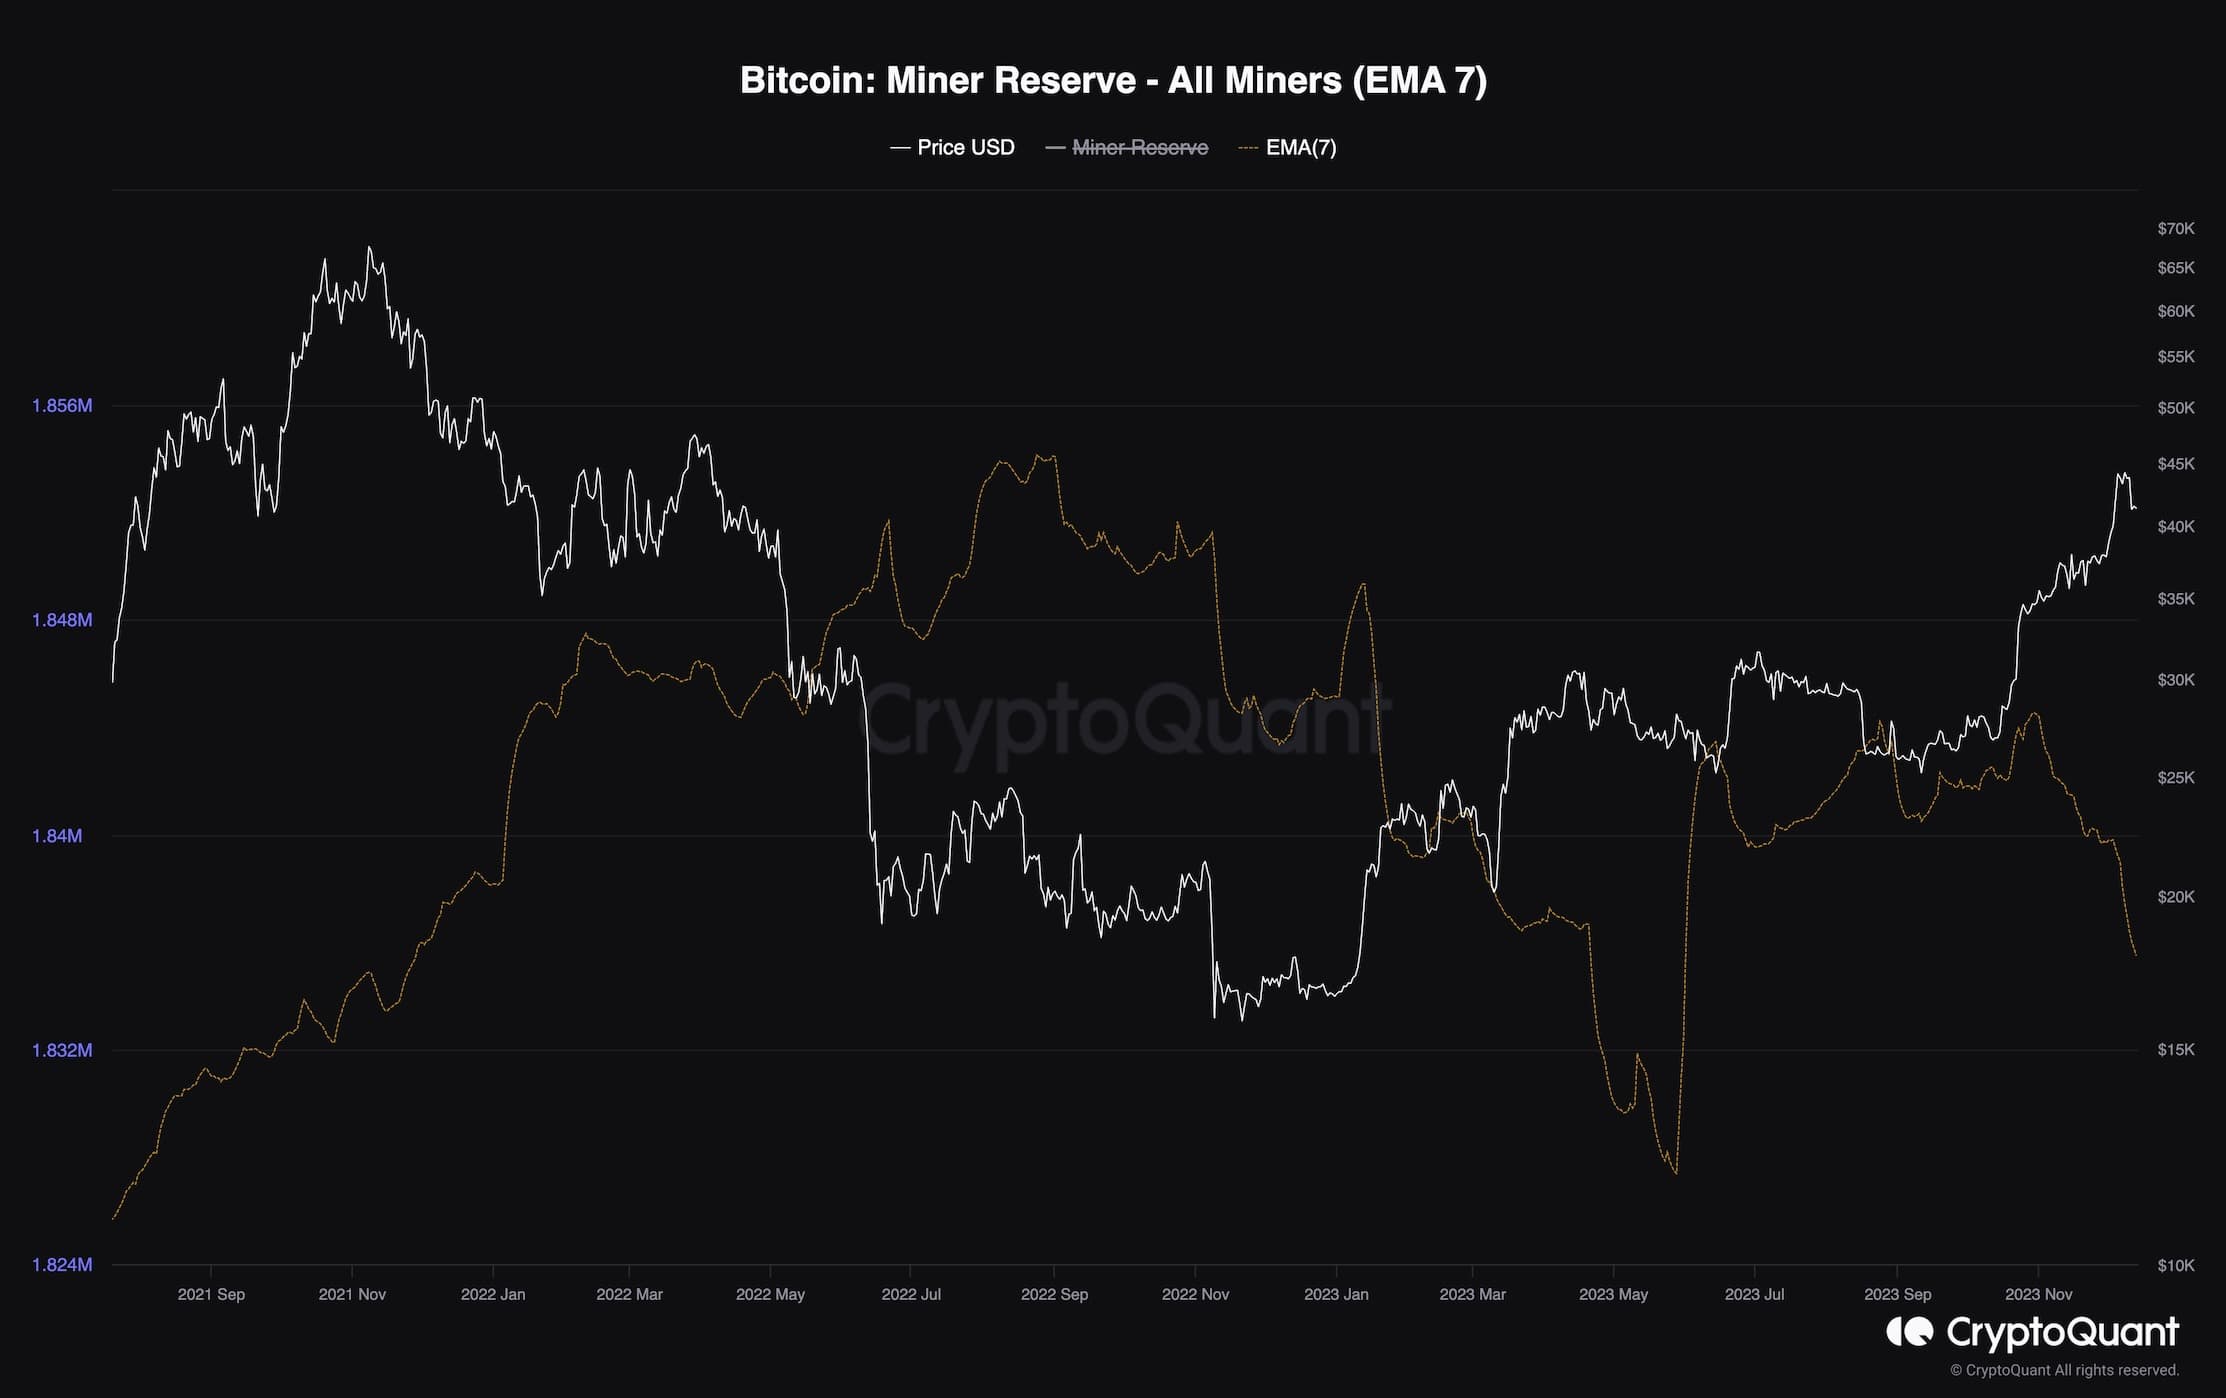
Bitcoin Miner Reserve (EMA 7)
Bitcoin’s price has rapidly risen over the last few months after creating a bottom in the $17K range. Meanwhile, many market participants wonder whether BTC is bound to make a new all-time high. In this situation, analyzing the miners’ behavior could provide valuable insight.
This chart presents the 7-day exponential moving average of the miner reserve metric. This metric measures the amount of BTC held in miners’ wallets. If it increases, it indicates that the miners are accumulating, while drops show pessimism by miners as they offload their Bitcoin.
The chart shows that the metric has been rapidly dropping after the price rose above the $35K mark. This observation hints at the fact that miners are potentially expecting the price to drop in the short term and that Bitcoin is currently overvalued.
Binance Free $100 (Exclusive): Use this link to register and receive $100 free and 10% off fees on Binance Futures first month (terms).
Disclaimer: Information found on CryptoPotato is those of writers quoted. It does not represent the opinions of CryptoPotato on whether to buy, sell, or hold any investments. You are advised to conduct your own research before making any investment decisions. Use provided information at your own risk. See Disclaimer for more information.
Cryptocurrency charts by TradingView.


